Microvast Holdings, Inc.'s (NASDAQ:MVST) market cap dropped US$31m last week; individual investors who hold 37% were hit as were institutions
Key Insights
The considerable ownership by individual investors in Microvast Holdings indicates that they collectively have a greater say in management and business strategy
The top 7 shareholders own 51% of the company
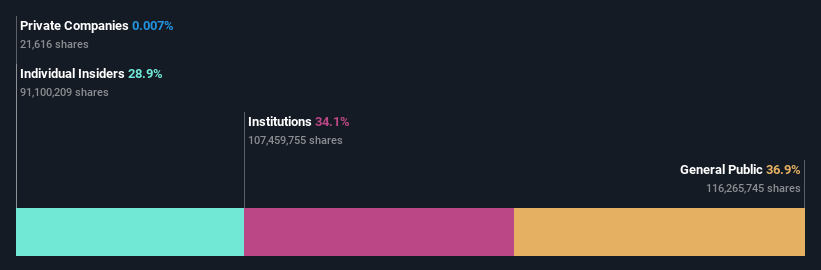
To get a sense of who is truly in control of Microvast Holdings, Inc. (NASDAQ:MVST), it is important to understand the ownership structure of the business. We can see that individual investors own the lion's share in the company with 37% ownership. Put another way, the group faces the maximum upside potential (or downside risk).
While the holdings of individual investors took a hit after last week’s 13% price drop, institutions with their 34% holdings also suffered.
Let's delve deeper into each type of owner of Microvast Holdings, beginning with the chart below.
Check out our latest analysis for Microvast Holdings
What Does The Institutional Ownership Tell Us About Microvast Holdings?
Institutional investors commonly compare their own returns to the returns of a commonly followed index. So they generally do consider buying larger companies that are included in the relevant benchmark index.
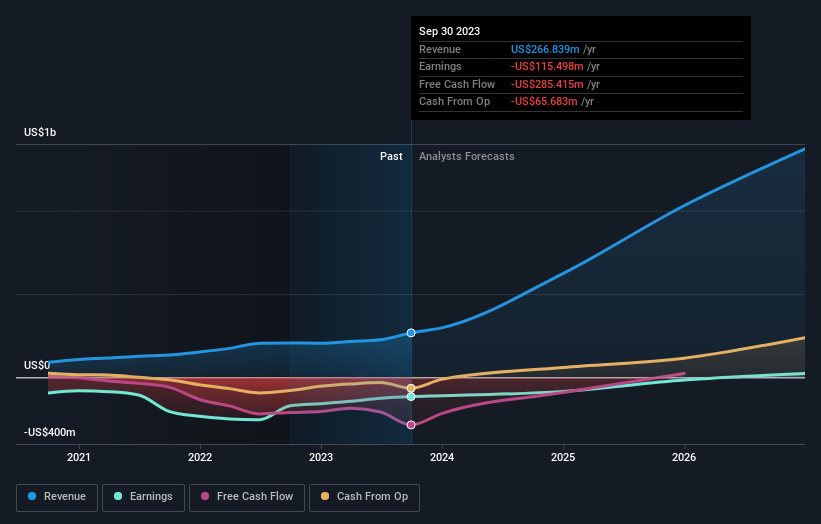
As you can see, institutional investors have a fair amount of stake in Microvast Holdings. This implies the analysts working for those institutions have looked at the stock and they like it. But just like anyone else, they could be wrong. If multiple institutions change their view on a stock at the same time, you could see the share price drop fast. It's therefore worth looking at Microvast Holdings' earnings history below. Of course, the future is what really matters.
Microvast Holdings is not owned by hedge funds. With a 27% stake, CEO Yang Wu is the largest shareholder. In comparison, the second and third largest shareholders hold about 7.5% and 5.3% of the stock.
On further inspection, we found that more than half the company's shares are owned by the top 7 shareholders, suggesting that the interests of the larger shareholders are balanced out to an extent by the smaller ones.
Researching institutional ownership is a good way to gauge and filter a stock's expected performance. The same can be achieved by studying analyst sentiments. There are plenty of analysts covering the stock, so it might be worth seeing what they are forecasting, too.
Insider Ownership Of Microvast Holdings
The definition of company insiders can be subjective and does vary between jurisdictions. Our data reflects individual insiders, capturing board members at the very least. Company management run the business, but the CEO will answer to the board, even if he or she is a member of it.
Insider ownership is positive when it signals leadership are thinking like the true owners of the company. However, high insider ownership can also give immense power to a small group within the company. This can be negative in some circumstances.
It seems insiders own a significant proportion of Microvast Holdings, Inc.. Insiders own US$64m worth of shares in the US$220m company. This may suggest that the founders still own a lot of shares. You can click here to see if they have been buying or selling.
General Public Ownership
The general public, who are usually individual investors, hold a 37% stake in Microvast Holdings. While this size of ownership may not be enough to sway a policy decision in their favour, they can still make a collective impact on company policies.
Next Steps:
It's always worth thinking about the different groups who own shares in a company. But to understand Microvast Holdings better, we need to consider many other factors. To that end, you should be aware of the 3 warning signs we've spotted with Microvast Holdings .
Ultimately the future is most important. You can access this free report on analyst forecasts for the company.
NB: Figures in this article are calculated using data from the last twelve months, which refer to the 12-month period ending on the last date of the month the financial statement is dated. This may not be consistent with full year annual report figures.
Have feedback on this article? Concerned about the content? Get in touch with us directly. Alternatively, email editorial-team (at) simplywallst.com.
This article by Simply Wall St is general in nature. We provide commentary based on historical data and analyst forecasts only using an unbiased methodology and our articles are not intended to be financial advice. It does not constitute a recommendation to buy or sell any stock, and does not take account of your objectives, or your financial situation. We aim to bring you long-term focused analysis driven by fundamental data. Note that our analysis may not factor in the latest price-sensitive company announcements or qualitative material. Simply Wall St has no position in any stocks mentioned.
