You Might Like Sangoma Technologies Corporation (CVE:STC) But Do You Like Its Debt?

Want to participate in a short research study? Help shape the future of investing tools and you could win a $250 gift card!
While small-cap stocks, such as Sangoma Technologies Corporation (CVE:STC) with its market cap of CA$89m, are popular for their explosive growth, investors should also be aware of their balance sheet to judge whether the company can survive a downturn. Assessing first and foremost the financial health is vital, since poor capital management may bring about bankruptcies, which occur at a higher rate for small-caps. We'll look at some basic checks that can form a snapshot the company’s financial strength. Nevertheless, this is not a comprehensive overview, so I suggest you dig deeper yourself into STC here.
Does STC Produce Much Cash Relative To Its Debt?
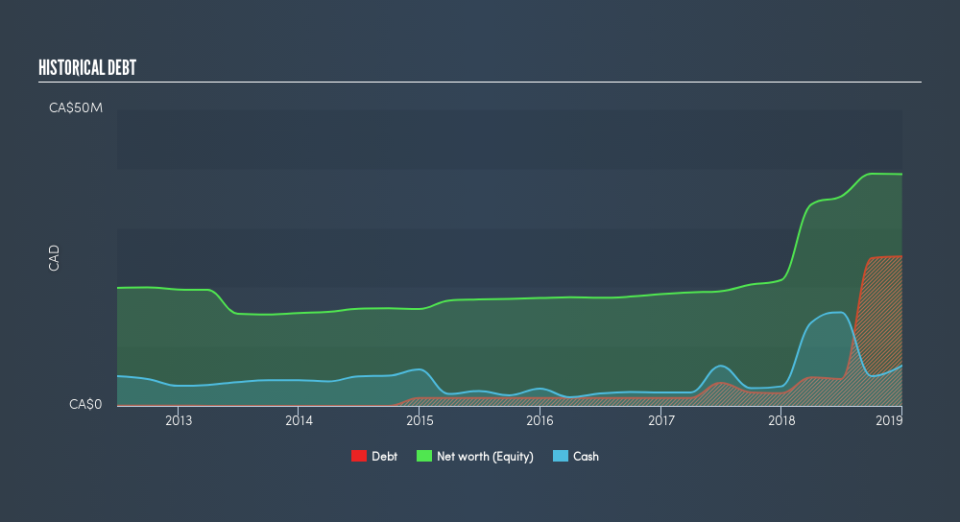
STC has built up its total debt levels in the last twelve months, from CA$2.2m to CA$25m , which accounts for long term debt. With this rise in debt, the current cash and short-term investment levels stands at CA$6.8m , ready to be used for running the business. Additionally, STC has generated cash from operations of CA$7.9m over the same time period, leading to an operating cash to total debt ratio of 31%, signalling that STC’s operating cash is sufficient to cover its debt.
Can STC meet its short-term obligations with the cash in hand?
Looking at STC’s CA$29m in current liabilities, it appears that the company has been able to meet these commitments with a current assets level of CA$29m, leading to a 1.02x current account ratio. The current ratio is the number you get when you divide current assets by current liabilities. Generally, for Communications companies, this is a reasonable ratio since there is a bit of a cash buffer without leaving too much capital in a low-return environment.
Can STC service its debt comfortably?
STC is a relatively highly levered company with a debt-to-equity of 64%. This is somewhat unusual for small-caps companies, since lenders are often hesitant to provide attractive interest rates to less-established businesses. We can test if STC’s debt levels are sustainable by measuring interest payments against earnings of a company. Ideally, earnings before interest and tax (EBIT) should cover net interest by at least three times. For STC, the ratio of 7.43x suggests that interest is appropriately covered, which means that lenders may be willing to lend out more funding as STC’s high interest coverage is seen as responsible and safe practice.
Next Steps:
STC’s high cash coverage means that, although its debt levels are high, the company is able to utilise its borrowings efficiently in order to generate cash flow. Since there is also no concerns around STC's liquidity needs, this may be its optimal capital structure for the time being. This is only a rough assessment of financial health, and I'm sure STC has company-specific issues impacting its capital structure decisions. I recommend you continue to research Sangoma Technologies to get a better picture of the small-cap by looking at:
Future Outlook: What are well-informed industry analysts predicting for STC’s future growth? Take a look at our free research report of analyst consensus for STC’s outlook.
Valuation: What is STC worth today? Is the stock undervalued, even when its growth outlook is factored into its intrinsic value? The intrinsic value infographic in our free research report helps visualize whether STC is currently mispriced by the market.
Other High-Performing Stocks: Are there other stocks that provide better prospects with proven track records? Explore our free list of these great stocks here.
We aim to bring you long-term focused research analysis driven by fundamental data. Note that our analysis may not factor in the latest price-sensitive company announcements or qualitative material.
If you spot an error that warrants correction, please contact the editor at editorial-team@simplywallst.com. This article by Simply Wall St is general in nature. It does not constitute a recommendation to buy or sell any stock, and does not take account of your objectives, or your financial situation. Simply Wall St has no position in the stocks mentioned. Thank you for reading.
