Molson Coors (TAP) Q2 Earnings Beat Estimates, Sales Lag
Molson Coors Beverage Company TAP has posted second-quarter 2023 results, wherein the bottom line surpassed the Zacks Consensus Estimate, but the top line lagged. However, both metrics improved year over year. Results have gained from the strong performance across its portfolio and both business units. However, the ongoing macroeconomic environment and beer industry softness acted as deterrents.
The Zacks Rank #1 (Strong Buy) stock has gained 7.2% in the past three months compared with the industry’s growth of 1.2%. However, shares of TAP fell more than 6% before the trading session on Aug 1.
Quarterly Details
The company’s adjusted earnings of $1.78 per share jumped 50% year over year and surpassed the Zacks Consensus Estimate of $1.63.
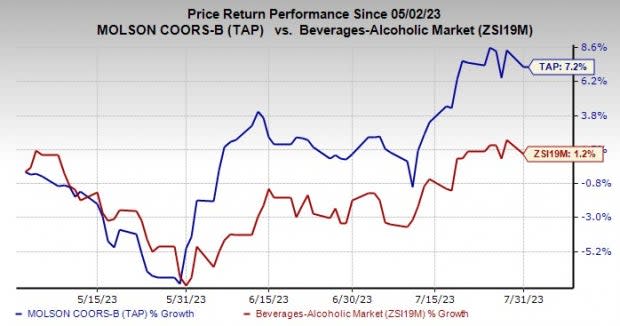
Image Source: Zacks Investment Research
Net sales grew 12% to $3,267 million but missed the Zacks Consensus Estimate of $3,309 million. On a constant-currency basis, net sales rose 12.1%, driven by a favorable price and sales mix, and higher financial volume.
Net sales per hectoliter increased 8.7% on a reported basis and 9% on a constant-currency basis, driven by strong net pricing, and a favorable sales mix stemming from the premiumization and geographic mix.
Molson Coors’ worldwide brand volumes rose 5% to 22.8 million, driven by strength in America, partially offset by the sluggishness in EMEA&APAC. Financial volumes advanced 2.8% to 23.4 million hectoliters due to higher volumes in the Americas, partly offset by increased EMEA&APAC volumes.
Underlying (non-GAAP) earnings before income taxes (EBT) advanced 53% year over year to $502.2 million. On a constant-currency basis, EBT jumped 53% due to higher net pricing, rising financial volumes, increased pricing and a positive sales mix, somewhat offset by cost inflation related to materials and manufacturing expenses, as well as higher MG&A expenses.
Segmental Information
Molson Coors operates under the following geographical segments.
Americas: Net sales in the segment increased 10.7% to $2,621.7 million on a reported basis and rose 11.5% on a constant-currency basis, driven by a positive price and sales mix, as well as higher financial volume, partly offset by unfavorable currency. The metric came ahead of our estimate of $2,439.1 million. Financial volumes rose 5% year over year, driven by an increase in U.S. domestic shipments stemming from volume growth in its premium brands, as well as higher shipments in
Canada.
Brand volume for the segment increased 8% year over year on an 8.7% rise in the United States, owing to double-digit growth across Coors Light, Miller Lite and Coors Banquet. Canada brand volumes rose 11.3%, driven by cycling the prior-year impacts of the Québec labor strike. Meanwhile, Latin America declined 5.9% due to industry softness in some major markets.
Net sales per hectoliter rose 5.4% year over year due to a favorable sales and price mix, and higher net pricing. Underlying EBT improved 40% on a constant-currency basis to $487.6 million. The increase can be attributed to higher pricing, rising financial volumes, lower logistics expenses and a favorable sales mix, offset by cost inflation on materials, conversion, and higher MG&A expenses.
EMEA&APAC: The segment’s net sales (on a reported basis) grew 16.3% to $649 million and improved 14.7% on a constant-currency basis, driven by a favorable price and sales mix, as well as favorable currency, partly offset by a decline in financial volume. The metric came ahead of our estimate of $560.8 million. Net sales per hectoliter for the segment advanced 19.9%, resulting from a favorable sales mix, as well as higher pricing, offset by currency headwinds.
The segment’s financial volumes fell 3%, while the brand volume decreased 2.9% due to declines in Central and Eastern Europe, stemming from inflationary pressures, partially offset by resilient demand and growth in above premium volumes in the U.K.
The segment’s underlying EBT increased 85% to a loss of $64.2 million on a reported basis and improved 83% on a constant-currency basis, driven by higher net pricing to customers, favorable sales mix, offset by lower financial volumes and cost inflation, particularly in materials, logistics and manufacturing expenses.
Other Financial Updates
Molson Coors ended the second quarter with cash and cash equivalents of $960.9 million. As of Jun 30, 2023, the company had a total debt of $6,615.1 million, resulting in a net debt of $5,654.2 million.
In the six months ending Jun 30, 2023, the company provided $894.4 million in cash by operating activities, resulting in an underlying free cash flow of $569.7 million. For 2023, capital expenditure is likely to be $700 million, plus or minus 5%.
In the six months ending Jun 30, 2023, the company declared and paid out cash dividends of 41 cents per share, with the CAD equivalent totaling $1.10 per share. Also, TAP repurchased 475,000 shares for $26.7 million during the above-mentioned period.
Molson Coors Beverage Company Price, Consensus and EPS Surprise
Molson Coors Beverage Company price-consensus-eps-surprise-chart | Molson Coors Beverage Company Quote
Outlook
Management has raised the 2023 view. Net sales are projected to grow year over year in the high-single digits on a constant-currency basis, up from the prior mentioned low-single digit growth. Underlying EBT is likely to grow 23-26% year over year compared with the earlier stated low-single-digit growth on a constant-currency basis.
Underlying depreciation and amortization are projected to be $690 million, plus or minus 5%. The company expects an underlying effective tax rate of 21-23%. Consolidated net interest expenses are anticipated to be $225 million, plus or minus 5%, down from the previously communicated $240 million, plus or minus 5%. The underlying free cash flow is likely to be $1.2 billion, plus or minus 10%, up from the prior view of $1 billion, plus or minus 10%.
Stocks to Consider
We highlighted some other top-ranked stocks from the broader Consumer Staples space, namely TreeHouse Foods THS, Celsius Holdings CELH and Associated British Foods ASBFY.
TreeHouse Foods, a manufacturer of packaged foods and beverages, currently sports a Zacks Rank #1. THS has a trailing four-quarter earnings surprise of 49.3%, on average. You can see the complete list of today’s Zacks #1 Rank stocks here.
The Zacks Consensus Estimate for TreeHouse Foods’ current financial year’s sales suggests a decline of 12.4% from the year-ago reported numbers.
Associated British Foods is a diversified international food, ingredients and retail group, which currently flaunts a Zacks Rank #1. ASBFY’s expected EPS growth rate for three to five years is 7%.
The Zacks Consensus Estimate for Associated British Foods’ current financial-year sales and earnings suggests growth of 30.4% and 4.2%, respectively, from the year-ago reported figures.
Celsius Holdings currently flaunts a Zacks Rank #2 (Buy). CELH specializes in commercializing healthier, nutritional functional foods, beverages and dietary supplements.
The Zacks Consensus Estimate for CELH’s current financial-year sales indicates 67.9% growth from the year-ago reported figure, and the same for EPS implies a 154% rise. The company had an earnings surprise of 81.8% in the last reported quarter.
Want the latest recommendations from Zacks Investment Research? Today, you can download 7 Best Stocks for the Next 30 Days. Click to get this free report
Molson Coors Beverage Company (TAP) : Free Stock Analysis Report
TreeHouse Foods, Inc. (THS) : Free Stock Analysis Report
Associated British Foods PLC (ASBFY) : Free Stock Analysis Report
Celsius Holdings Inc. (CELH) : Free Stock Analysis Report
