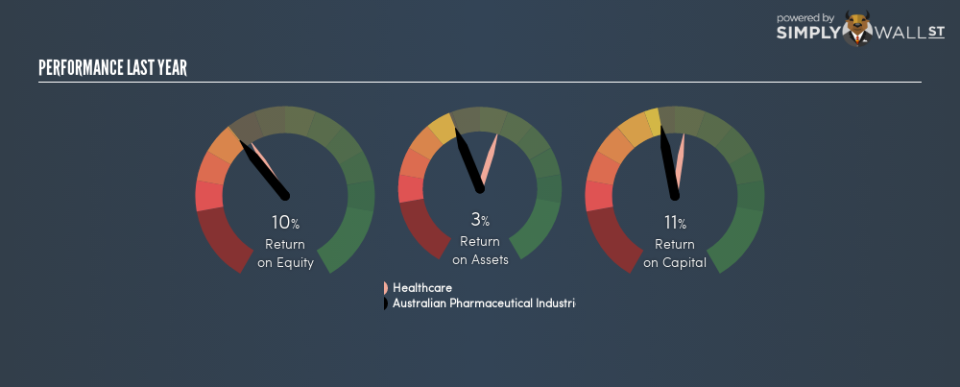
Is There More To Australian Pharmaceutical Industries Limited (ASX:API) Than Its 11%Returns On Capital?

Want to participate in a short research study? Help shape the future of investing tools and you could win a $250 gift card!
Today we’ll look at Australian Pharmaceutical Industries Limited (ASX:API) and reflect on its potential as an investment. In particular, we’ll consider its Return On Capital Employed (ROCE), as that can give us insight into how profitably the company is able to employ capital in its business.
First of all, we’ll work out how to calculate ROCE. Then we’ll compare its ROCE to similar companies. Finally, we’ll look at how its current liabilities affect its ROCE.
Understanding Return On Capital Employed (ROCE)
ROCE is a metric for evaluating how much pre-tax income (in percentage terms) a company earns on the capital invested in its business. Generally speaking a higher ROCE is better. Overall, it is a valuable metric that has its flaws. Renowned investment researcher Michael Mauboussin has suggested that a high ROCE can indicate that ‘one dollar invested in the company generates value of more than one dollar’.
So, How Do We Calculate ROCE?
Analysts use this formula to calculate return on capital employed:
Return on Capital Employed = Earnings Before Interest and Tax (EBIT) ÷ (Total Assets – Current Liabilities)
Or for Australian Pharmaceutical Industries:
0.11 = AU$74m ÷ (AU$1.5b – AU$815m) (Based on the trailing twelve months to August 2018.)
So, Australian Pharmaceutical Industries has an ROCE of 11%.
Check out our latest analysis for Australian Pharmaceutical Industries
Does Australian Pharmaceutical Industries Have A Good ROCE?
When making comparisons between similar businesses, investors may find ROCE useful. Using our data, Australian Pharmaceutical Industries’s ROCE appears to be around the 11% average of the Healthcare industry. Separate from Australian Pharmaceutical Industries’s performance relative to its industry, its ROCE in absolute terms looks satisfactory, and it may be worth researching in more depth.
When considering ROCE, bear in mind that it reflects the past and does not necessarily predict the future. ROCE can be misleading for companies in cyclical industries, with returns looking impressive during the boom times, but very weak during the busts. ROCE is only a point-in-time measure. What happens in the future is pretty important for investors, so we have prepared a free report on analyst forecasts for Australian Pharmaceutical Industries.
Australian Pharmaceutical Industries’s Current Liabilities And Their Impact On Its ROCE
Current liabilities include invoices, such as supplier payments, short-term debt, or a tax bill, that need to be paid within 12 months. Due to the way ROCE is calculated, a high level of current liabilities makes a company look as though it has less capital employed, and thus can (sometimes unfairly) boost the ROCE. To check the impact of this, we calculate if a company has high current liabilities relative to its total assets.
Australian Pharmaceutical Industries has total assets of AU$1.5b and current liabilities of AU$815m. Therefore its current liabilities are equivalent to approximately 54% of its total assets. This is admittedly a high level of current liabilities, improving ROCE substantially.
What We Can Learn From Australian Pharmaceutical Industries’s ROCE
The ROCE would not look as appealing if the company had fewer current liabilities. Of course, you might find a fantastic investment by looking at a few good candidates. So take a peek at this free list of companies with modest (or no) debt, trading on a P/E below 20.
I will like Australian Pharmaceutical Industries better if I see some big insider buys. While we wait, check out this free list of growing companies with considerable, recent, insider buying.
To help readers see past the short term volatility of the financial market, we aim to bring you a long-term focused research analysis purely driven by fundamental data. Note that our analysis does not factor in the latest price-sensitive company announcements.
The author is an independent contributor and at the time of publication had no position in the stocks mentioned. For errors that warrant correction please contact the editor at editorial-team@simplywallst.com.
