Is There More To Fortescue Metals Group Limited (ASX:FMG) Than Its 11%Returns On Capital?

Want to participate in a short research study? Help shape the future of investing tools and you could win a $250 gift card!
Today we’ll evaluate Fortescue Metals Group Limited (ASX:FMG) to determine whether it could have potential as an investment idea. Specifically, we’re going to calculate its Return On Capital Employed (ROCE), in the hopes of getting some insight into the business.
First up, we’ll look at what ROCE is and how we calculate it. Then we’ll compare its ROCE to similar companies. Finally, we’ll look at how its current liabilities affect its ROCE.
What is Return On Capital Employed (ROCE)?
ROCE measures the ‘return’ (pre-tax profit) a company generates from capital employed in its business. Generally speaking a higher ROCE is better. In brief, it is a useful tool, but it is not without drawbacks. Renowned investment researcher Michael Mauboussin has suggested that a high ROCE can indicate that ‘one dollar invested in the company generates value of more than one dollar’.
How Do You Calculate Return On Capital Employed?
Analysts use this formula to calculate return on capital employed:
Return on Capital Employed = Earnings Before Interest and Tax (EBIT) ÷ (Total Assets – Current Liabilities)
Or for Fortescue Metals Group:
0.11 = US$1.8b ÷ (US$18b – US$1.2b) (Based on the trailing twelve months to June 2018.)
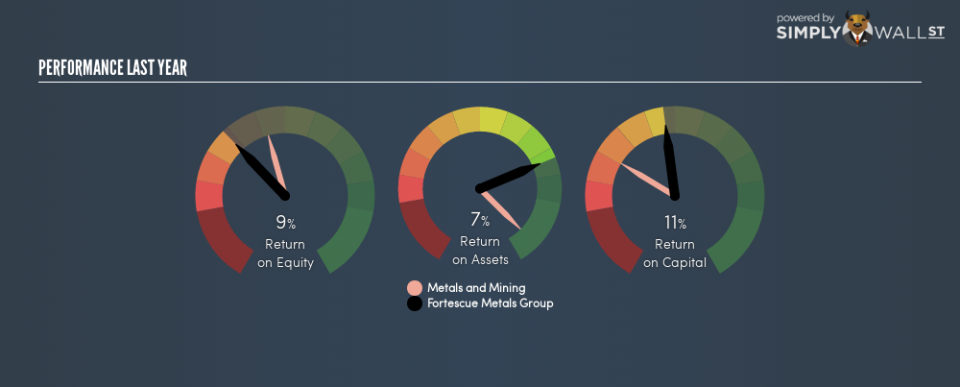
So, Fortescue Metals Group has an ROCE of 11%.
View our latest analysis for Fortescue Metals Group
Does Fortescue Metals Group Have A Good ROCE?
ROCE is commonly used for comparing the performance of similar businesses. We can see Fortescue Metals Group’s ROCE is around the 12% average reported by the Metals and Mining industry. Independently of how Fortescue Metals Group compares to its industry, its ROCE in absolute terms appears decent, and the company may be worthy of closer investigation.
As we can see, Fortescue Metals Group currently has an ROCE of 11% compared to its ROCE 3 years ago, which was 4.9%. This makes us think about whether the company has been reinvesting shrewdly.
When considering ROCE, bear in mind that it reflects the past and does not necessarily predict the future. ROCE can be misleading for companies in cyclical industries, with returns looking impressive during the boom times, but very weak during the busts. ROCE is only a point-in-time measure. We note Fortescue Metals Group could be considered a cyclical business. Future performance is what matters, and you can see analyst predictions in our free report on analyst forecasts for the company.
Do Fortescue Metals Group’s Current Liabilities Skew Its ROCE?
Liabilities, such as supplier bills and bank overdrafts, are referred to as current liabilities if they need to be paid within 12 months. Due to the way ROCE is calculated, a high level of current liabilities makes a company look as though it has less capital employed, and thus can (sometimes unfairly) boost the ROCE. To counter this, investors can check if a company has high current liabilities relative to total assets.
Fortescue Metals Group has total assets of US$18b and current liabilities of US$1.2b. Therefore its current liabilities are equivalent to approximately 6.9% of its total assets. Low current liabilities have only a minimal impact on Fortescue Metals Group’s ROCE, making its decent returns more credible.
What We Can Learn From Fortescue Metals Group’s ROCE
If Fortescue Metals Group can continue reinvesting in its business, it could be an attractive prospect. Of course, you might find a fantastic investment by looking at a few good candidates. So take a peek at this free list of companies with modest (or no) debt, trading on a P/E below 20.
If you are like me, then you will not want to miss this free list of growing companies that insiders are buying.
To help readers see past the short term volatility of the financial market, we aim to bring you a long-term focused research analysis purely driven by fundamental data. Note that our analysis does not factor in the latest price-sensitive company announcements.
The author is an independent contributor and at the time of publication had no position in the stocks mentioned. For errors that warrant correction please contact the editor at editorial-team@simplywallst.com.
