Is The Mosaic Co (MOS) Significantly Undervalued?
The Mosaic Co (NYSE:MOS) has recently experienced a daily loss of 1.57%, although the company's 3-month gain stands at 7.45%. The Earnings Per Share (EPS) is currently at 6.33. This article aims to explore whether The Mosaic Co (NYSE:MOS) is significantly undervalued. Let's delve into the valuation analysis to find out.
Introduction to The Mosaic Co
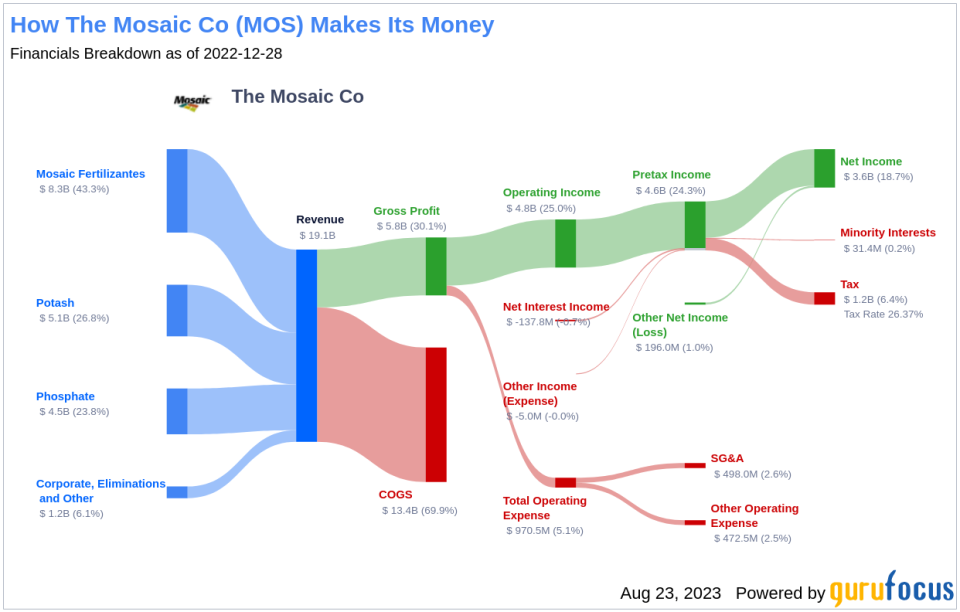
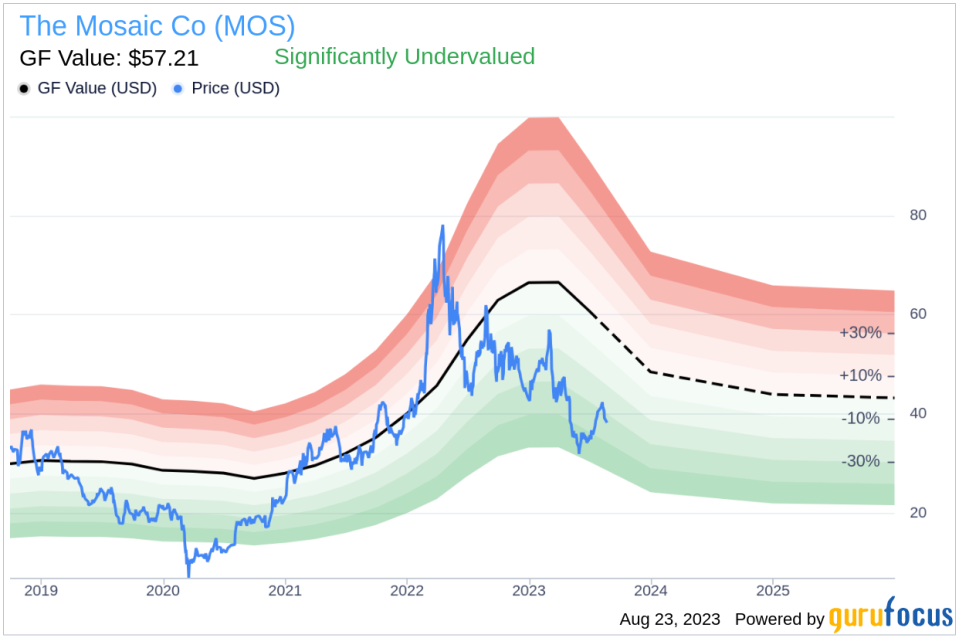
Formed in 2004 from the merger of IMC Global and Cargill's fertilizer business, The Mosaic Co is a leading producer of primary crop nutrients, phosphate, and potash. The company operates phosphate rock mines in Florida, Louisiana, Brazil, and Peru, and potash mines in Saskatchewan, New Mexico, and Brazil. The Mosaic Co's stock price currently stands at $38.25 while its GF Value, an estimation of fair value, is $57.21. This suggests that the stock may be significantly undervalued.
Understanding the GF Value of The Mosaic Co
The GF Value is a proprietary measure that represents the current intrinsic value of a stock. It is calculated by considering historical trading multiples, a GuruFocus adjustment factor based on past performance and growth, and future business performance estimates. The GF Value Line on our summary page provides an overview of the fair value at which the stock should ideally be traded.
The Mosaic Co (NYSE:MOS) appears to be significantly undervalued according to the GuruFocus Value calculation. This is based on the stock's historical trading multiples, past business growth, and analyst estimates of future business performance. The current price of $38.25 per share and the market cap of $12.70 billion suggest that The Mosaic Co stock is significantly undervalued. Consequently, the long-term return of its stock is likely to be much higher than its business growth.
Link: These companies may deliver higher future returns at reduced risk.
Financial Strength of The Mosaic Co
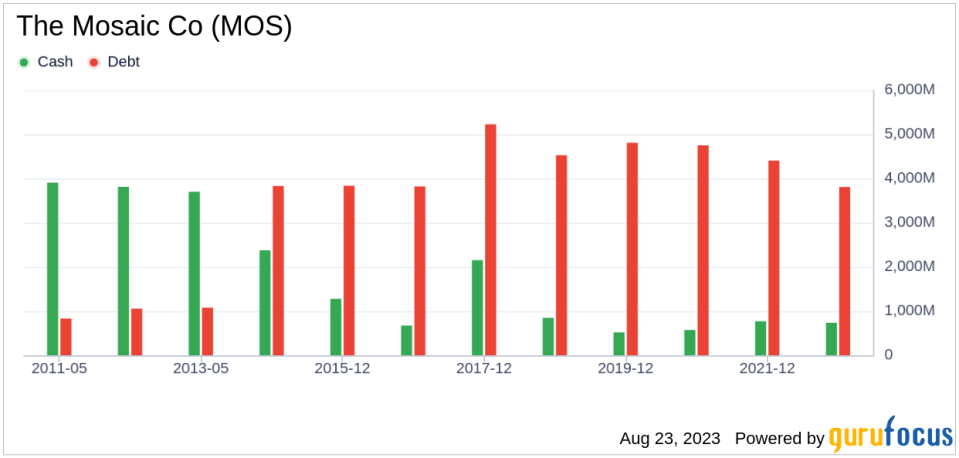
Before investing in a company, it's crucial to assess its financial strength. Companies with poor financial strength pose a higher risk of permanent loss to investors. The Mosaic Co's cash-to-debt ratio is 0.16, which is worse than 76.29% of 232 companies in the Agriculture industry. Despite this, the overall financial strength of The Mosaic Co is 6 out of 10, indicating fair financial health.
Profitability and Growth of The Mosaic Co
Companies that consistently demonstrate profitability offer less risk to investors. The Mosaic Co has been profitable for 8 out of the past 10 years. With a revenue of $16.80 billion and Earnings Per Share (EPS) of $6.33 in the past twelve months, the company's operating margin is 16.46%. This ranks better than 78.51% of 228 companies in the Agriculture industry, indicating strong profitability.
Looking at growth, one of the most important factors in a company's valuation, The Mosaic Co's average annual revenue growth is 32.3%, ranking better than 80.18% of 217 companies in the Agriculture industry. However, the 3-year average EBITDA growth is 0%, ranking worse than all 206 companies in the Agriculture industry.
ROIC vs WACC
Profitability can also be evaluated by comparing a company's return on invested capital (ROIC) to its weighted average cost of capital (WACC). The Mosaic Co's ROIC of 10.36 exceeds its WACC of 9.97, suggesting that the company is creating value for its shareholders.

Conclusion
In summary, The Mosaic Co (NYSE:MOS) appears to be significantly undervalued. The company's financial condition is fair, and its profitability is strong. However, its growth ranks worse than all 206 companies in the Agriculture industry. To learn more about The Mosaic Co stock, you can check out its 30-Year Financials here.
To discover high-quality companies that may deliver above-average returns, please check out the GuruFocus High Quality Low Capex Screener.
This article first appeared on GuruFocus.
