Most Shareholders Will Probably Find That The CEO Compensation For Flexiroam Limited (ASX:FRX) Is Reasonable
Key Insights
Flexiroam's Annual General Meeting to take place on 31st of October
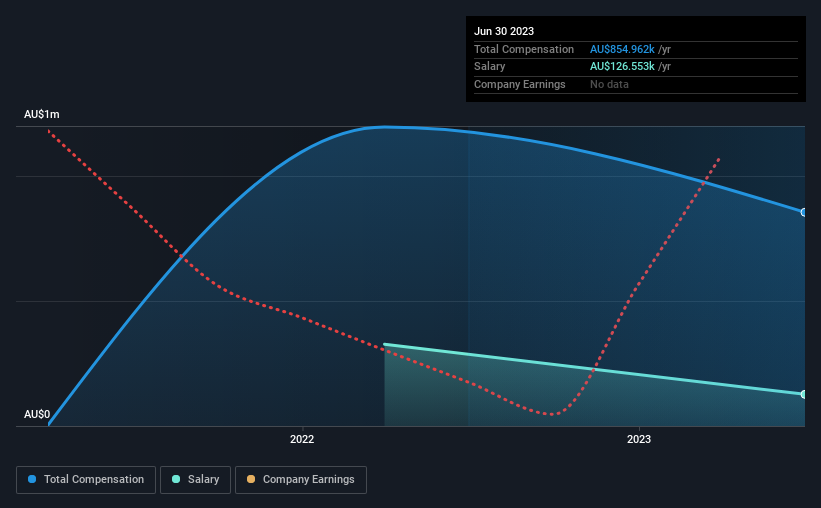
CEO Marc Barnett's total compensation includes salary of AU$126.6k
Total compensation is similar to the industry average
Flexiroam's EPS grew by 8.1% over the past three years while total shareholder return over the past three years was 50%
CEO Marc Barnett has done a decent job of delivering relatively good performance at Flexiroam Limited (ASX:FRX) recently. In light of this performance, CEO compensation will probably not be the main focus for shareholders as they go into the AGM on 31st of October. Here is our take on why we think the CEO compensation looks appropriate.
View our latest analysis for Flexiroam
How Does Total Compensation For Marc Barnett Compare With Other Companies In The Industry?
Our data indicates that Flexiroam Limited has a market capitalization of AU$22m, and total annual CEO compensation was reported as AU$855k for the year to June 2023. Notably, that's a decrease of 29% over the year before. We think total compensation is more important but our data shows that the CEO salary is lower, at AU$127k.
On comparing similar-sized companies in the Australian Telecom industry with market capitalizations below AU$315m, we found that the median total CEO compensation was AU$676k. So it looks like Flexiroam compensates Marc Barnett in line with the median for the industry. Furthermore, Marc Barnett directly owns AU$1.3m worth of shares in the company, implying that they are deeply invested in the company's success.
Component | 2023 | 2022 | Proportion (2023) |
Salary | AU$127k | AU$327k | 15% |
Other | AU$728k | AU$868k | 85% |
Total Compensation | AU$855k | AU$1.2m | 100% |
Speaking on an industry level, nearly 45% of total compensation represents salary, while the remainder of 55% is other remuneration. Flexiroam sets aside a smaller share of compensation for salary, in comparison to the overall industry. If non-salary compensation dominates total pay, it's an indicator that the executive's salary is tied to company performance.
A Look at Flexiroam Limited's Growth Numbers
Flexiroam Limited's earnings per share (EPS) grew 8.1% per year over the last three years. Its revenue is up 143% over the last year.
It's hard to interpret the strong revenue growth as anything other than a positive. With that in mind, the modestly improving EPS seems positive. So while we'd stop short of saying growth is absolutely outstanding, there are definitely some clear positives! Although we don't have analyst forecasts, you might want to assess this data-rich visualization of earnings, revenue and cash flow.
Has Flexiroam Limited Been A Good Investment?
Boasting a total shareholder return of 50% over three years, Flexiroam Limited has done well by shareholders. As a result, some may believe the CEO should be paid more than is normal for companies of similar size.
To Conclude...
Seeing that the company has put up a decent performance, only a few shareholders, if any at all, might have questions about the CEO pay in the upcoming AGM. However, we still think that any proposed increase in CEO compensation will be examined closely to make sure the compensation is appropriate and linked to performance.
It is always advisable to analyse CEO pay, along with performing a thorough analysis of the company's key performance areas. That's why we did our research, and identified 5 warning signs for Flexiroam (of which 3 are potentially serious!) that you should know about in order to have a holistic understanding of the stock.
Arguably, business quality is much more important than CEO compensation levels. So check out this free list of interesting companies that have HIGH return on equity and low debt.
Have feedback on this article? Concerned about the content? Get in touch with us directly. Alternatively, email editorial-team (at) simplywallst.com.
This article by Simply Wall St is general in nature. We provide commentary based on historical data and analyst forecasts only using an unbiased methodology and our articles are not intended to be financial advice. It does not constitute a recommendation to buy or sell any stock, and does not take account of your objectives, or your financial situation. We aim to bring you long-term focused analysis driven by fundamental data. Note that our analysis may not factor in the latest price-sensitive company announcements or qualitative material. Simply Wall St has no position in any stocks mentioned.

