Are Mothercare plc (LON:MTC) Investors Paying Above The Intrinsic Value?
Key Insights
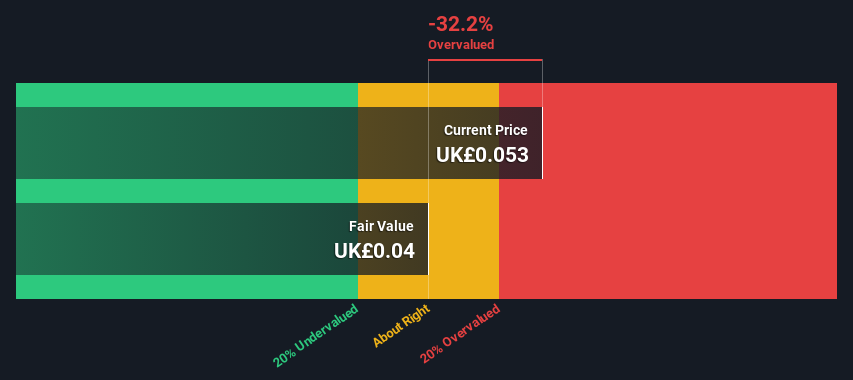
Using the 2 Stage Free Cash Flow to Equity, Mothercare fair value estimate is UK£0.04
Mothercare's UK£0.053 share price signals that it might be 32% overvalued
Analyst price target for MTC is UK£0.14, which is 237% above our fair value estimate
Today we will run through one way of estimating the intrinsic value of Mothercare plc (LON:MTC) by projecting its future cash flows and then discounting them to today's value. The Discounted Cash Flow (DCF) model is the tool we will apply to do this. Models like these may appear beyond the comprehension of a lay person, but they're fairly easy to follow.
We would caution that there are many ways of valuing a company and, like the DCF, each technique has advantages and disadvantages in certain scenarios. If you want to learn more about discounted cash flow, the rationale behind this calculation can be read in detail in the Simply Wall St analysis model.
Check out our latest analysis for Mothercare
What's The Estimated Valuation?
We're using the 2-stage growth model, which simply means we take in account two stages of company's growth. In the initial period the company may have a higher growth rate and the second stage is usually assumed to have a stable growth rate. In the first stage we need to estimate the cash flows to the business over the next ten years. Where possible we use analyst estimates, but when these aren't available we extrapolate the previous free cash flow (FCF) from the last estimate or reported value. We assume companies with shrinking free cash flow will slow their rate of shrinkage, and that companies with growing free cash flow will see their growth rate slow, over this period. We do this to reflect that growth tends to slow more in the early years than it does in later years.
Generally we assume that a dollar today is more valuable than a dollar in the future, so we discount the value of these future cash flows to their estimated value in today's dollars:
10-year free cash flow (FCF) forecast
2024 | 2025 | 2026 | 2027 | 2028 | 2029 | 2030 | 2031 | 2032 | 2033 | |
Levered FCF (£, Millions) | UK£1.00m | UK£1.25m | UK£1.47m | UK£1.66m | UK£1.82m | UK£1.95m | UK£2.06m | UK£2.14m | UK£2.22m | UK£2.28m |
Growth Rate Estimate Source | Analyst x1 | Est @ 24.85% | Est @ 17.85% | Est @ 12.95% | Est @ 9.52% | Est @ 7.12% | Est @ 5.44% | Est @ 4.26% | Est @ 3.44% | Est @ 2.86% |
Present Value (£, Millions) Discounted @ 9.4% | UK£0.9 | UK£1.0 | UK£1.1 | UK£1.2 | UK£1.2 | UK£1.1 | UK£1.1 | UK£1.0 | UK£1.0 | UK£0.9 |
("Est" = FCF growth rate estimated by Simply Wall St)
Present Value of 10-year Cash Flow (PVCF) = UK£11m
The second stage is also known as Terminal Value, this is the business's cash flow after the first stage. For a number of reasons a very conservative growth rate is used that cannot exceed that of a country's GDP growth. In this case we have used the 5-year average of the 10-year government bond yield (1.5%) to estimate future growth. In the same way as with the 10-year 'growth' period, we discount future cash flows to today's value, using a cost of equity of 9.4%.
Terminal Value (TV)= FCF2033 × (1 + g) ÷ (r – g) = UK£2.3m× (1 + 1.5%) ÷ (9.4%– 1.5%) = UK£29m
Present Value of Terminal Value (PVTV)= TV / (1 + r)10= UK£29m÷ ( 1 + 9.4%)10= UK£12m
The total value is the sum of cash flows for the next ten years plus the discounted terminal value, which results in the Total Equity Value, which in this case is UK£23m. To get the intrinsic value per share, we divide this by the total number of shares outstanding. Compared to the current share price of UK£0.05, the company appears reasonably expensive at the time of writing. The assumptions in any calculation have a big impact on the valuation, so it is better to view this as a rough estimate, not precise down to the last cent.
The Assumptions
Now the most important inputs to a discounted cash flow are the discount rate, and of course, the actual cash flows. If you don't agree with these result, have a go at the calculation yourself and play with the assumptions. The DCF also does not consider the possible cyclicality of an industry, or a company's future capital requirements, so it does not give a full picture of a company's potential performance. Given that we are looking at Mothercare as potential shareholders, the cost of equity is used as the discount rate, rather than the cost of capital (or weighted average cost of capital, WACC) which accounts for debt. In this calculation we've used 9.4%, which is based on a levered beta of 1.331. Beta is a measure of a stock's volatility, compared to the market as a whole. We get our beta from the industry average beta of globally comparable companies, with an imposed limit between 0.8 and 2.0, which is a reasonable range for a stable business.
SWOT Analysis for Mothercare
Strength
No major strengths identified for MTC.
Weakness
Earnings declined over the past year.
Interest payments on debt are not well covered.
Expensive based on P/E ratio and estimated fair value.
Opportunity
Annual earnings are forecast to grow faster than the British market.
Significant insider buying over the past 3 months.
Threat
Debt is not well covered by operating cash flow.
Total liabilities exceed total assets, which raises the risk of financial distress.
Annual revenue is forecast to grow slower than the British market.
Moving On:
Whilst important, the DCF calculation shouldn't be the only metric you look at when researching a company. DCF models are not the be-all and end-all of investment valuation. Preferably you'd apply different cases and assumptions and see how they would impact the company's valuation. For instance, if the terminal value growth rate is adjusted slightly, it can dramatically alter the overall result. Why is the intrinsic value lower than the current share price? For Mothercare, we've compiled three fundamental factors you should assess:
Risks: We feel that you should assess the 6 warning signs for Mothercare (3 are a bit concerning!) we've flagged before making an investment in the company.
Management:Have insiders been ramping up their shares to take advantage of the market's sentiment for MTC's future outlook? Check out our management and board analysis with insights on CEO compensation and governance factors.
Other Solid Businesses: Low debt, high returns on equity and good past performance are fundamental to a strong business. Why not explore our interactive list of stocks with solid business fundamentals to see if there are other companies you may not have considered!
PS. The Simply Wall St app conducts a discounted cash flow valuation for every stock on the AIM every day. If you want to find the calculation for other stocks just search here.
Have feedback on this article? Concerned about the content? Get in touch with us directly. Alternatively, email editorial-team (at) simplywallst.com.
This article by Simply Wall St is general in nature. We provide commentary based on historical data and analyst forecasts only using an unbiased methodology and our articles are not intended to be financial advice. It does not constitute a recommendation to buy or sell any stock, and does not take account of your objectives, or your financial situation. We aim to bring you long-term focused analysis driven by fundamental data. Note that our analysis may not factor in the latest price-sensitive company announcements or qualitative material. Simply Wall St has no position in any stocks mentioned.
