MSC Industrial (MSM) Q3 Earnings Miss Estimates, Revenues Beat
MSC Industrial Direct Company, Inc. MSM reported third-quarter fiscal 2023 (ended on Jun 3, 2023) adjusted earnings per share (EPS) of $1.74, missing the Zacks Consensus Estimate of adjusted earnings per share of $1.75. The bottom line declined 4% year over year on higher costs which were somewhat offset by savings from the Mission Critical initiative.
Including one-time items, the company reported EPS of $1.69, compared with the year-ago quarter’s figure of $1.78.
MSC Industrial generated revenues of around $1,055 million in the quarter under review, up 10% from $959 million reported in the year-ago quarter. The top line beat the Zacks Consensus Estimate of $1,020 million. Average daily sales growth was 11.7%, approximately 11 percentage points higher than the IP Index. This marked the second consecutive quarter that the company has surpassed the index by double digits. MSM has been witnessing double-digit average daily sales growth for five quarters in a row.
MSC Industrial Direct Company, Inc. Price, Consensus and EPS Surprise
MSC Industrial Direct Company, Inc. price-consensus-eps-surprise-chart | MSC Industrial Direct Company, Inc. Quote
Operational Update
The cost of goods sold increased 14% year over year to $626 million. Gross profit was up 4% to $429 million. The gross margin was 40.7%, compared with the year-ago quarter’s figure of 42.9%.
Operating expenses rose 8% year over year to $292 million in the fiscal third quarter. Adjusted operating income amounted to $139 million, down 1% from $140 million in the prior-year quarter. Adjusted operating margin was 13.1% in the reported quarter, compared with the prior-year quarter’s figure of 14.6%.
Financial Position
MSC Industrial had cash and cash equivalents of $58.4 million at the end of the third quarter of 2023, compared with $43.5 million at the end of fiscal 2022. The company generated cash flow from operating activities of $567 million in the first nine-month period of fiscal 2023, reflecting a solid improvement from $135 million in the comparable period in the prior fiscal.
The company’s long-term debt was $174 million at the end of the reported quarter, down from $469 million at fiscal 2022-end.
Guidance
MSC Industrial expects average daily sales growth of 10% to 11% for fiscal 2023. The adjusted operating margin is expected to be around 12.7%. The company expects additional savings of $15 million from the Mission Critical initiative in fiscal 2023.
Price Performance
MSC Industrial’s shares have gained 27.7% in the past year compared with the industry’s 37.5% growth.
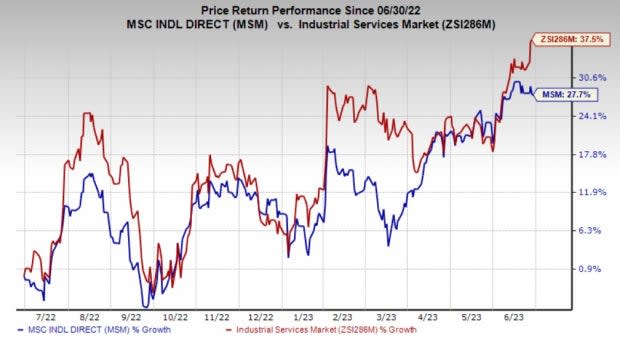
Image Source: Zacks Investment Research
Zacks Rank & Stocks to Consider
MSC Industrial currently carries a Zacks Rank #3 (Hold).
Some better-ranked stocks from the Industrial Products sector are Hubbell Incorporated HUBB, The Manitowoc Company, Inc. MTW and W.W. Grainger, Inc. GWW. HUBB and MTW sport a Zacks Rank #1 (Strong Buy) at present, and GWW has a Zacks Rank #2 (Buy). You can see the complete list of today’s Zacks #1 Rank stocks here.
Hubbell has an average trailing four-quarter earnings surprise of 21%. The Zacks Consensus Estimate for HUBB’s fiscal 2023 earnings is pegged at $13.81 per share. The consensus estimate for 2023 earnings has moved 22.5% north in the past 60 days. Its shares have gained 70.3% in the last year.
Manitowoc has an average trailing four-quarter earnings surprise of 38.8%. The Zacks Consensus Estimate for MTW’s 2023 earnings is pegged at 85 cents per share. The consensus estimate for 2023 earnings has moved 63.5% north in the past 60 days. MTW’s shares have gained 61.1% in the last year.
The Zacks Consensus Estimate for Grainger’s 2023 earnings per share is pegged at $35.83, up 7.6% in the past 60 days. It has a trailing four-quarter average earnings surprise of 9.1%. GWW gained 59% in the last year.
Want the latest recommendations from Zacks Investment Research? Today, you can download 7 Best Stocks for the Next 30 Days. Click to get this free report
MSC Industrial Direct Company, Inc. (MSM) : Free Stock Analysis Report
