How Much Of Ooma, Inc. (NYSE:OOMA) Do Insiders Own?
A look at the shareholders of Ooma, Inc. (NYSE:OOMA) can tell us which group is most powerful. Insiders often own a large chunk of younger, smaller, companies while huge companies tend to have institutions as shareholders. I quite like to see at least a little bit of insider ownership. As Charlie Munger said 'Show me the incentive and I will show you the outcome.
Ooma is a smaller company with a market capitalization of US$460m, so it may still be flying under the radar of many institutional investors. Our analysis of the ownership of the company, below, shows that institutions own shares in the company. Let's take a closer look to see what the different types of shareholders can tell us about Ooma.
See our latest analysis for Ooma
What Does The Institutional Ownership Tell Us About Ooma?
Institutional investors commonly compare their own returns to the returns of a commonly followed index. So they generally do consider buying larger companies that are included in the relevant benchmark index.
As you can see, institutional investors have a fair amount of stake in Ooma. This suggests some credibility amongst professional investors. But we can't rely on that fact alone since institutions make bad investments sometimes, just like everyone does. If multiple institutions change their view on a stock at the same time, you could see the share price drop fast. It's therefore worth looking at Ooma's earnings history below. Of course, the future is what really matters.

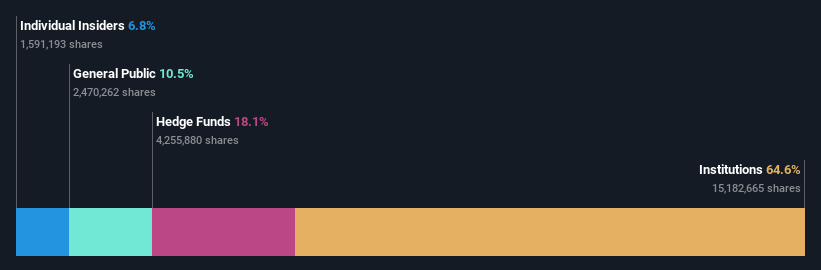
Since institutional investors own more than half the issued stock, the board will likely have to pay attention to their preferences. Our data indicates that hedge funds own 18% of Ooma. That's interesting, because hedge funds can be quite active and activist. Many look for medium term catalysts that will drive the share price higher. BlackRock, Inc. is currently the company's largest shareholder with 7.4% of shares outstanding. Meanwhile, the second and third largest shareholders, hold 6.7% and 6.4%, of the shares outstanding, respectively. Furthermore, CEO Eric Stang is the owner of 3.8% of the company's shares.
A closer look at our ownership figures suggests that the top 11 shareholders have a combined ownership of 53% implying that no single shareholder has a majority.
Researching institutional ownership is a good way to gauge and filter a stock's expected performance. The same can be achieved by studying analyst sentiments. There are plenty of analysts covering the stock, so it might be worth seeing what they are forecasting, too.
Insider Ownership Of Ooma
The definition of company insiders can be subjective and does vary between jurisdictions. Our data reflects individual insiders, capturing board members at the very least. Company management run the business, but the CEO will answer to the board, even if he or she is a member of it.
Insider ownership is positive when it signals leadership are thinking like the true owners of the company. However, high insider ownership can also give immense power to a small group within the company. This can be negative in some circumstances.
We can see that insiders own shares in Ooma, Inc.. It has a market capitalization of just US$460m, and insiders have US$31m worth of shares, in their own names. It is good to see some investment by insiders, but it might be worth checking if those insiders have been buying.
General Public Ownership
With a 11% ownership, the general public have some degree of sway over Ooma. This size of ownership, while considerable, may not be enough to change company policy if the decision is not in sync with other large shareholders.
Next Steps:
I find it very interesting to look at who exactly owns a company. But to truly gain insight, we need to consider other information, too. Be aware that Ooma is showing 1 warning sign in our investment analysis , you should know about...
If you are like me, you may want to think about whether this company will grow or shrink. Luckily, you can check this free report showing analyst forecasts for its future.
NB: Figures in this article are calculated using data from the last twelve months, which refer to the 12-month period ending on the last date of the month the financial statement is dated. This may not be consistent with full year annual report figures.
This article by Simply Wall St is general in nature. We provide commentary based on historical data and analyst forecasts only using an unbiased methodology and our articles are not intended to be financial advice. It does not constitute a recommendation to buy or sell any stock, and does not take account of your objectives, or your financial situation. We aim to bring you long-term focused analysis driven by fundamental data. Note that our analysis may not factor in the latest price-sensitive company announcements or qualitative material. Simply Wall St has no position in any stocks mentioned.
Have feedback on this article? Concerned about the content? Get in touch with us directly. Alternatively, email editorial-team (at) simplywallst.com.
