Is Mullen Group Ltd.'s (TSE:MTL) Latest Stock Performance Being Led By Its Strong Fundamentals?
Most readers would already know that Mullen Group's (TSE:MTL) stock increased by 3.0% over the past three months. Given its impressive performance, we decided to study the company's key financial indicators as a company's long-term fundamentals usually dictate market outcomes. In this article, we decided to focus on Mullen Group's ROE.
Return on equity or ROE is a key measure used to assess how efficiently a company's management is utilizing the company's capital. In simpler terms, it measures the profitability of a company in relation to shareholder's equity.
View our latest analysis for Mullen Group
How Is ROE Calculated?
Return on equity can be calculated by using the formula:
Return on Equity = Net Profit (from continuing operations) ÷ Shareholders' Equity
So, based on the above formula, the ROE for Mullen Group is:
17% = CA$169m ÷ CA$967m (Based on the trailing twelve months to September 2023).
The 'return' is the amount earned after tax over the last twelve months. Another way to think of that is that for every CA$1 worth of equity, the company was able to earn CA$0.17 in profit.
What Is The Relationship Between ROE And Earnings Growth?
So far, we've learned that ROE is a measure of a company's profitability. We now need to evaluate how much profit the company reinvests or "retains" for future growth which then gives us an idea about the growth potential of the company. Assuming all else is equal, companies that have both a higher return on equity and higher profit retention are usually the ones that have a higher growth rate when compared to companies that don't have the same features.
Mullen Group's Earnings Growth And 17% ROE
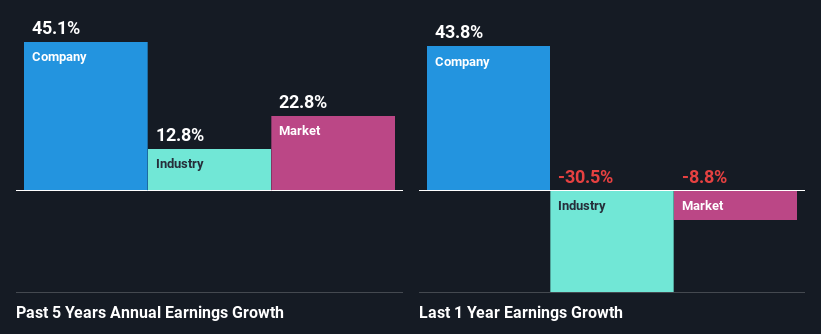
At first glance, Mullen Group seems to have a decent ROE. And on comparing with the industry, we found that the the average industry ROE is similar at 20%. This certainly adds some context to Mullen Group's exceptional 45% net income growth seen over the past five years. We reckon that there could also be other factors at play here. Such as - high earnings retention or an efficient management in place.
As a next step, we compared Mullen Group's net income growth with the industry, and pleasingly, we found that the growth seen by the company is higher than the average industry growth of 13%.
Earnings growth is a huge factor in stock valuation. The investor should try to establish if the expected growth or decline in earnings, whichever the case may be, is priced in. Doing so will help them establish if the stock's future looks promising or ominous. Is Mullen Group fairly valued compared to other companies? These 3 valuation measures might help you decide.
Is Mullen Group Using Its Retained Earnings Effectively?
The high three-year median payout ratio of 52% (implying that it keeps only 48% of profits) for Mullen Group suggests that the company's growth wasn't really hampered despite it returning most of the earnings to its shareholders.
Moreover, Mullen Group is determined to keep sharing its profits with shareholders which we infer from its long history of paying a dividend for at least ten years. Our latest analyst data shows that the future payout ratio of the company over the next three years is expected to be approximately 50%. However, Mullen Group's future ROE is expected to decline to 13% despite there being not much change anticipated in the company's payout ratio.
Summary
In total, we are pretty happy with Mullen Group's performance. In particular, its high ROE is quite noteworthy and also the probable explanation behind its considerable earnings growth. Yet, the company is retaining a small portion of its profits. Which means that the company has been able to grow its earnings in spite of it, so that's not too bad. That being so, according to the latest industry analyst forecasts, the company's earnings are expected to shrink in the future. Are these analysts expectations based on the broad expectations for the industry, or on the company's fundamentals? Click here to be taken to our analyst's forecasts page for the company.
Have feedback on this article? Concerned about the content? Get in touch with us directly. Alternatively, email editorial-team (at) simplywallst.com.
This article by Simply Wall St is general in nature. We provide commentary based on historical data and analyst forecasts only using an unbiased methodology and our articles are not intended to be financial advice. It does not constitute a recommendation to buy or sell any stock, and does not take account of your objectives, or your financial situation. We aim to bring you long-term focused analysis driven by fundamental data. Note that our analysis may not factor in the latest price-sensitive company announcements or qualitative material. Simply Wall St has no position in any stocks mentioned.
