This Must-Know ETF Beats the Market Over the Long Term

We often hear investors talk about how hard it is to “beat the market” over time, and when it comes to ETFs, for the most part, they are right. ETFs that beat the broader market indices like the S&P 500 over the long run are rare.
Using the Vanguard S&P 500 ETF (NYSEARCA:VOO) as a proxy for the S&P 500, it’s easy to see why. As of the end of the most recent month, the fund has provided enviable total annualized returns of 12.8% over the past three years, 11% over the past five years, and 11.9% over the past 10. Since its inception in 2010, the fund has returned 13.3% annually.
The Invesco S&P 500 Quality ETF (BATS:SPHQ) is an ETF that also invests in the S&P 500, albeit with more specific criteria. Let’s take a look at if it is a good investment opportunity and how it stacks up to the Vanguard S&P 500 ETF, with a focus on long-term performance.
What Does the SPHQ ETF Do?
SPHQ is a $5.3 billion ETF from Invesco that invests at least 90% of its assets in the S&P 500 Quality Index. This index takes the S&P 500 and invests in the stocks with the highest quality score, which is based on financial metrics like return on equity, changes in net operating assets, and financial leverage.
SPHQ vs. VOO Portfolio Comparison
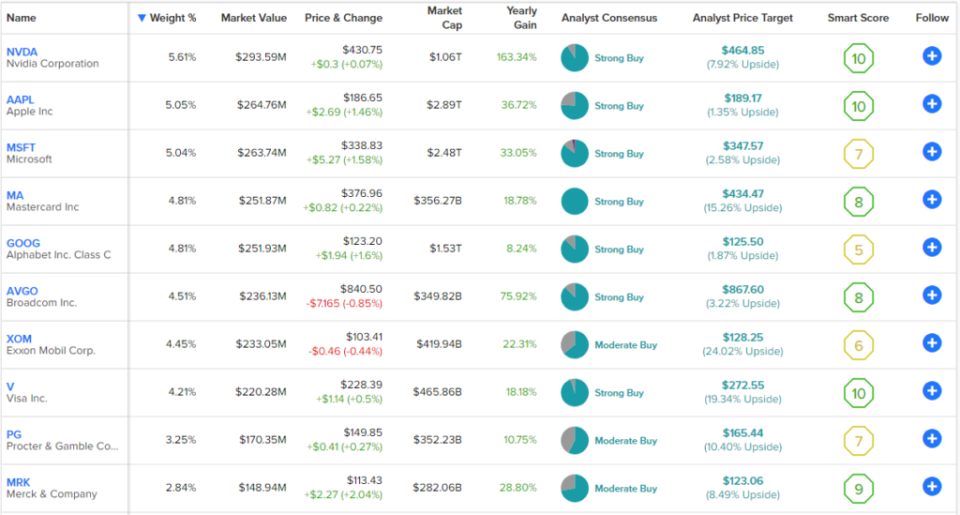
SPHQ is fairly diversified, with 101 holdings, and its top 10 positions make up 48.5% of the fund. Below, you can take a look at SPHQ’s top 10 holdings using TipRanks’ holdings tool.
VOO sports 505 positions, investing in the entire S&P 500. Its top 10 holdings make up 30.4% of the fund. Take a look at VOO’s top holdings below.
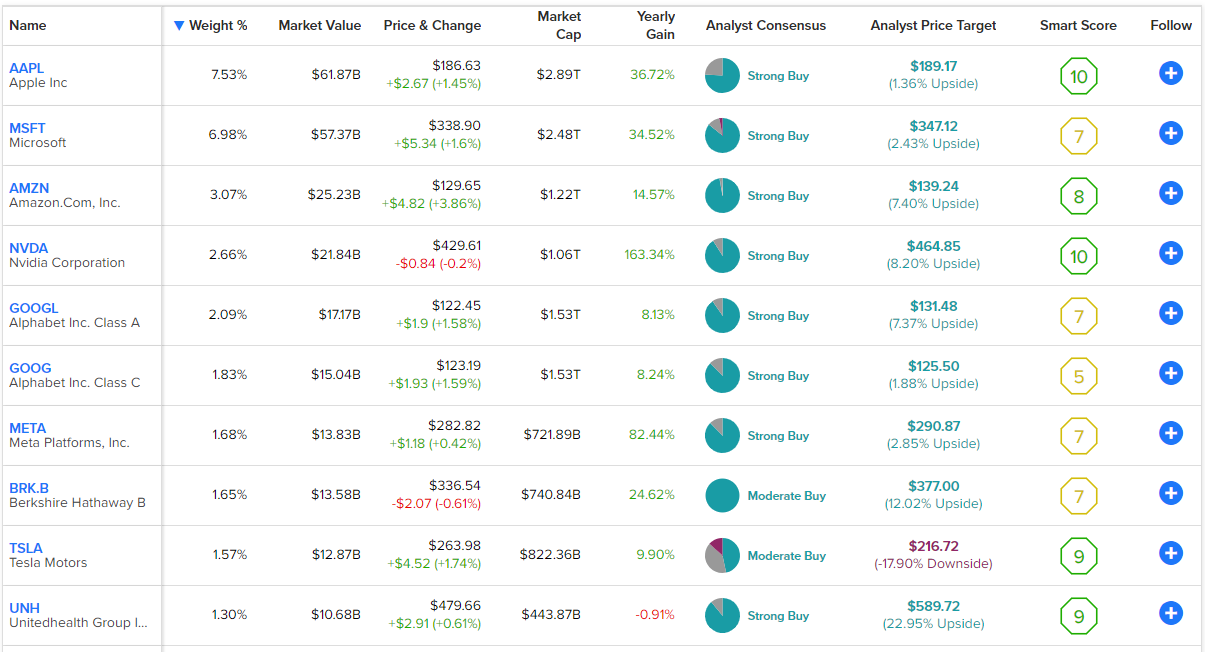
VOO is clearly more diversified, as it invests in the entire S&P 500 instead of just a segment of it, but overall, both of these ETFs are well-diversified.
Additionally, as you can see in the tables above, there is some overlap between SPHQ and VOO despite their different strategies. Both ETFs count Apple and Microsoft among their top 10 holdings.
However, SPHQ has top 10 positions in integrated oil majors like ExxonMobil, payment networks Visa and Mastercard, and consumer staples like Procter & Gamble.
Six of SPHQ’s top 10 holdings have Smart Scores of 8 or above, while five of VOO’s do. The Smart Score is TipRanks’ proprietary quantitative stock scoring system. It gives stocks a score from 1 to 10 based on eight market key factors. The score is data-driven and does not involve any human intervention. A Smart Score of 8 or above is equivalent to an Outperform rating.
SPHQ and VOO feature identical ETF Smart Scores of 8.


Comparing Their Long-Term Track Records
When looking at any ETF, you want to evaluate its performance over time. SPHQ has provided its investors with very solid results for a long time. As of the end of May, SPHQ has a three-year annualized total return of 12.4%, a five-year annualized total return of 11.4%, and a 10-year annualized total return of 12.1%. Double-digit returns over the course of a decade are the type of results that help investors to build long-term wealth, making SPHQ an attractive ETF to own.
Over time, SPHQ’s results have been comparable to those of VOO. Over the past three years, VOO has beaten SPHQ by a narrow margin with a total annualized return of 12.8%. But over the past five years, SPHQ’s annualized return of 11.4% is actually slightly better than VOO’s 11% return. Over the past 10 years, SPHQ also leads VOO by a narrow margin of 12.1% to 11.9.%, making SPHQ one of the rare ETFs that can say it has “beaten the market” over the long term, albeit by a very narrow margin.
Which ETF Has Lower Fees?
SPHQ has a reasonable expense ratio of 0.15%. This means that an investor putting $10,000 into SPHQ today would pay $15 in management fees in year one. Assuming the fee remains constant and that the fund returns 5% a year, an investor in SPHQ would pay $53 in fees after three years, $99 after five years, and $234 over the course of a decade.
These are reasonable enough fees especially given SPHQ’s double-digit returns. However, VOO’s returns are comparable, and its fees are much lower. With an expense ratio of 0.03%, an investor in VOO would pay just $3 in fees in year one, $10 over three years, $17 over five years, and $39 over the course of the decade, offering substantial savings against SPHQ.
Investor Takeaway
Ultimately, SPHQ is one of the few ETFs that can make a credible claim that it has beaten the market over the long term since it has outperformed a broad S&P 500 fund like VOO over the five and 10-year time frames, albeit by narrow margins.
On the other hand, VOO offers a much lower expense ratio than SPHQ for a roughly similar performance.
An investor putting $10,000 into SPHQ over the past 10 years and earning a 12.1% total annualized return would now have a position worth about $31,337. Meanwhile, an investor putting the same amount into VOO would have $30,782. Both investors would be pretty happy with their returns, but SPHQ has the edge. Keep in mind that past performance is no guarantee of future results, so there’s no guarantee that SPHQ’s strategy will outperform the S&P 500 again over the next decade.
Going forward, the ETFs currently look somewhat different in terms of their current portfolio composition, with VOO having the large-cap tech stocks that dominate the S&P 500 index in terms of market cap, whereas SPHQ features some of these stocks but leaves out some prominent names like Amazon and Tesla.
Overall, these are both great ETFs to own, and both have helped investors compound double-digit total returns for years. Holding either of these ETFs has helped investors to more than triple the size of their investments over the past 10 years.
The choice between the two may come down to your preference based on the current flavor of their portfolios, as described above. Conversely, there is no need to pick just one, an investor could invest in both ETFs and likely be happy with their long-term results.
