What You Must Know About Fortive Corporation's (NYSE:FTV) Financial Strength

Investors seeking to preserve capital in a volatile environment might consider large-cap stocks such as Fortive Corporation (NYSE:FTV) a safer option. Market participants who are conscious of risk tend to search for large firms, attracted by the prospect of varied revenue sources and strong returns on capital. However, its financial health remains the key to continued success. Today we will look at Fortive’s financial liquidity and debt levels, which are strong indicators for whether the company can weather economic downturns or fund strategic acquisitions for future growth. Remember this is a very top-level look that focuses exclusively on financial health, so I recommend a deeper analysis into FTV here.
Want to participate in a short research study? Help shape the future of investing tools and you could win a $250 gift card!
Check out our latest analysis for Fortive
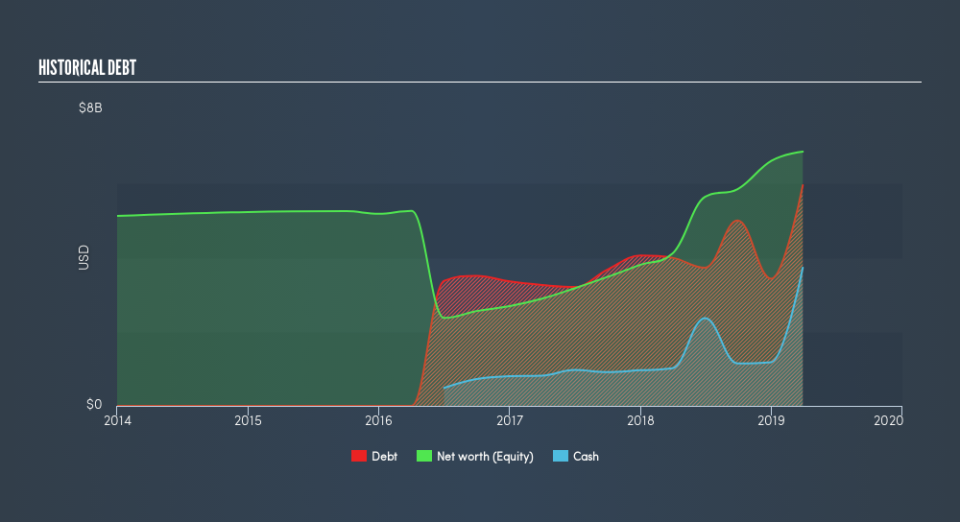
FTV’s Debt (And Cash Flows)
FTV's debt levels surged from US$4.0b to US$6.0b over the last 12 months – this includes long-term debt. With this rise in debt, FTV currently has US$3.7b remaining in cash and short-term investments to keep the business going. Additionally, FTV has produced cash from operations of US$1.3b during the same period of time, leading to an operating cash to total debt ratio of 22%, meaning that FTV’s current level of operating cash is high enough to cover debt.
Does FTV’s liquid assets cover its short-term commitments?
Looking at FTV’s US$2.6b in current liabilities, it appears that the company has maintained a safe level of current assets to meet its obligations, with the current ratio last standing at 2.2x. The current ratio is calculated by dividing current assets by current liabilities. For Machinery companies, this ratio is within a sensible range as there's enough of a cash buffer without holding too much capital in low return investments.
Can FTV service its debt comfortably?
With a debt-to-equity ratio of 87%, FTV can be considered as an above-average leveraged company. This is not unusual for large-caps since debt tends to be less expensive than equity because interest payments are tax deductible. Accordingly, large companies often have lower cost of capital due to easily obtained financing, providing an advantage over smaller companies. No matter how high the company’s debt, if it can easily cover the interest payments, it’s considered to be efficient with its use of excess leverage. Preferably, earnings before interest and tax (EBIT) should be at least three times as large as net interest. For FTV, the ratio of 11.58x suggests that interest is comfortably covered. High interest coverage is seen as a responsible and safe practice, which highlights why most investors believe large-caps such as FTV is a safe investment.
Next Steps:
At its current level of cash flow coverage, FTV has room for improvement to better cushion for events which may require debt repayment. However, the company exhibits an ability to meet its near-term obligations, which isn't a big surprise for a large-cap. This is only a rough assessment of financial health, and I'm sure FTV has company-specific issues impacting its capital structure decisions. I recommend you continue to research Fortive to get a more holistic view of the stock by looking at:
Future Outlook: What are well-informed industry analysts predicting for FTV’s future growth? Take a look at our free research report of analyst consensus for FTV’s outlook.
Valuation: What is FTV worth today? Is the stock undervalued, even when its growth outlook is factored into its intrinsic value? The intrinsic value infographic in our free research report helps visualize whether FTV is currently mispriced by the market.
Other High-Performing Stocks: Are there other stocks that provide better prospects with proven track records? Explore our free list of these great stocks here.
We aim to bring you long-term focused research analysis driven by fundamental data. Note that our analysis may not factor in the latest price-sensitive company announcements or qualitative material.
If you spot an error that warrants correction, please contact the editor at editorial-team@simplywallst.com. This article by Simply Wall St is general in nature. It does not constitute a recommendation to buy or sell any stock, and does not take account of your objectives, or your financial situation. Simply Wall St has no position in the stocks mentioned. Thank you for reading.
