What You Must Know About Neonode Inc’s (NASDAQ:NEON) Financial Strength

Investors are always looking for growth in small-cap stocks like Neonode Inc (NASDAQ:NEON), with a market cap of US$19.92m. However, an important fact which most ignore is: how financially healthy is the business? Electronic companies, especially ones that are currently loss-making, are more likely to be higher risk. Assessing first and foremost the financial health is crucial. I believe these basic checks tell most of the story you need to know. Though, this commentary is still very high-level, so I suggest you dig deeper yourself into NEON here.
How much cash does NEON generate through its operations?
NEON’s debt levels surged from US$1.19m to US$2.25m over the last 12 months made up of predominantly near term debt. With this rise in debt, NEON currently has US$5.80m remaining in cash and short-term investments , ready to deploy into the business. Moving onto cash from operations, its small level of operating cash flow means calculating cash-to-debt wouldn’t be too useful, though these low levels of cash means that operational efficiency is worth a look. As the purpose of this article is a high-level overview, I won’t be looking at this today, but you can assess some of NEON’s operating efficiency ratios such as ROA here.
Can NEON meet its short-term obligations with the cash in hand?
With current liabilities at US$3.58m, the company has been able to meet these obligations given the level of current assets of US$9.80m, with a current ratio of 2.73x. For Electronic companies, this ratio is within a sensible range as there’s enough of a cash buffer without holding too capital in low return investments.
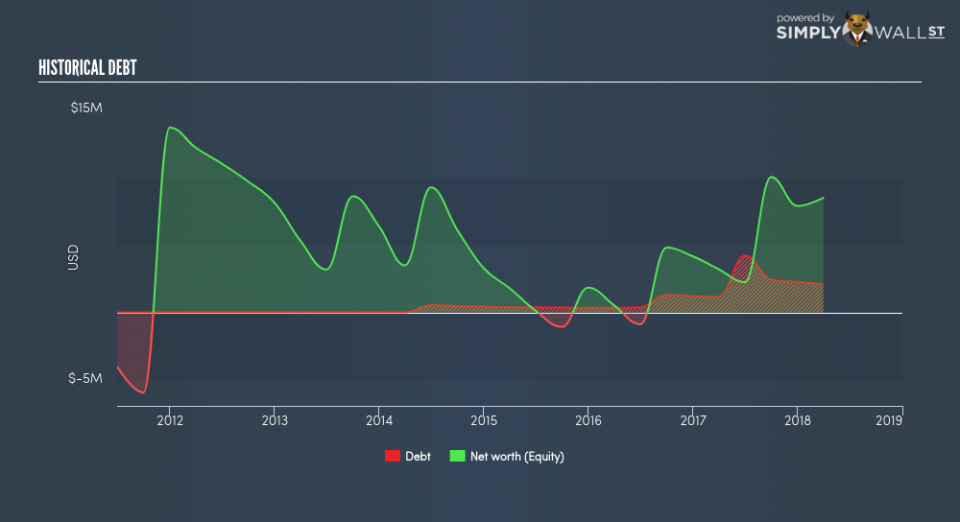
Does NEON face the risk of succumbing to its debt-load?
NEON’s level of debt is appropriate relative to its total equity, at 24.55%. This range is considered safe as NEON is not taking on too much debt obligation, which may be constraining for future growth. Risk around debt is very low for NEON, and the company also has the ability and headroom to increase debt if needed going forward.
Next Steps:
NEON’s low debt is also met with low coverage. This indicates room for improvement as its cash flow covers less than a quarter of its borrowings, which means its operating efficiency could be better. However, the company exhibits an ability to meet its near term obligations should an adverse event occur. Keep in mind I haven’t considered other factors such as how NEON has been performing in the past. I recommend you continue to research Neonode to get a better picture of the stock by looking at:
Future Outlook: What are well-informed industry analysts predicting for NEON’s future growth? Take a look at our free research report of analyst consensus for NEON’s outlook.
Valuation: What is NEON worth today? Is the stock undervalued, even when its growth outlook is factored into its intrinsic value? The intrinsic value infographic in our free research report helps visualize whether NEON is currently mispriced by the market.
Other High-Performing Stocks: Are there other stocks that provide better prospects with proven track records? Explore our free list of these great stocks here.
To help readers see pass the short term volatility of the financial market, we aim to bring you a long-term focused research analysis purely driven by fundamental data. Note that our analysis does not factor in the latest price sensitive company announcements.
The author is an independent contributor and at the time of publication had no position in the stocks mentioned.
