What You Must Know About Oil Search Limited’s (ASX:OSH) Return on Equity

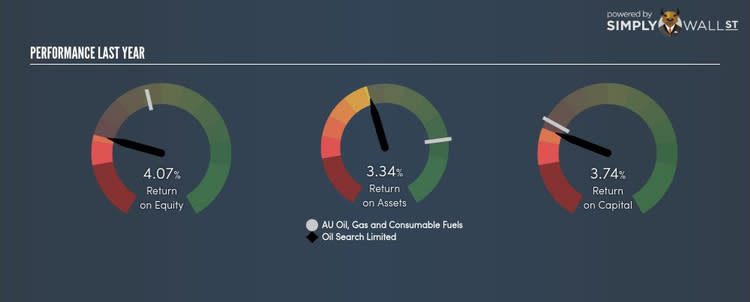
Oil Search Limited (ASX:OSH) generated a below-average return on equity of 4.07% in the past 12 months, while its industry returned 13.91%. Though OSH's recent performance is underwhelming, it is useful to understand what ROE is made up of and how it should be interpreted. Knowing these components can change your views on OSH's below-average returns. Today I will look at how components such as financial leverage can influence ROE which may impact the sustainability of OSH's returns. View our latest analysis for Oil Search
Peeling the layers of ROE – trisecting a company’s profitability
Return on Equity (ROE) is a measure of OSH’s profit relative to its shareholders’ equity. For example, if OSH invests $1 in the form of equity, it will generate $0.04 in earnings from this. In most cases, a higher ROE is preferred; however, there are many other factors we must consider prior to making any investment decisions.
Return on Equity = Net Profit ÷ Shareholders Equity
Returns are usually compared to costs to measure the efficiency of capital. OSH’s cost of equity is 8.55%. This means OSH’s returns actually do not cover its own cost of equity, with a discrepancy of -4.48%. This isn’t sustainable as it implies, very simply, that the company pays more for its capital than what it generates in return. ROE can be dissected into three distinct ratios: net profit margin, asset turnover, and financial leverage. This is called the Dupont Formula:
Dupont Formula
ROE = profit margin × asset turnover × financial leverage
ROE = (annual net profit ÷ sales) × (sales ÷ assets) × (assets ÷ shareholders’ equity)
ROE = annual net profit ÷ shareholders’ equity
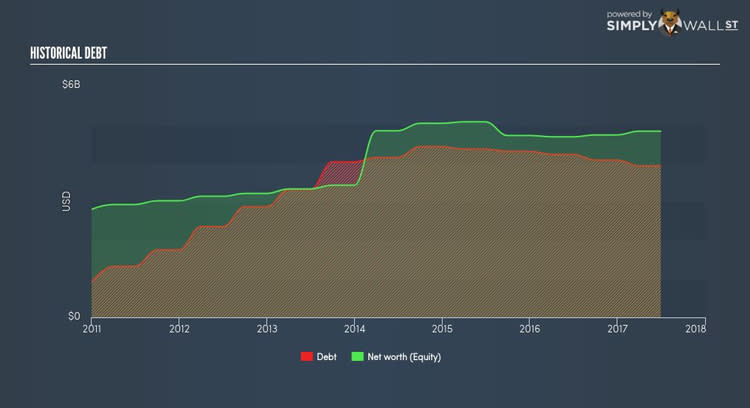
Essentially, profit margin shows how much money the company makes after paying for all its expenses. Asset turnover reveals how much revenue can be generated from OSH’s asset base. And finally, financial leverage is simply how much of assets are funded by equity, which exhibits how sustainable OSH’s capital structure is. Since ROE can be artificially increased through excessive borrowing, we should check OSH’s historic debt-to-equity ratio. The debt-to-equity ratio currently stands at a sensible 81.33%, meaning the ROE is a result of its capacity to produce profit growth without a huge debt burden.
What this means for you:
Are you a shareholder? OSH’s below-industry ROE is disappointing, furthermore, its returns were not even high enough to cover its own cost of equity. However, investors shouldn’t despair since ROE is not inflated by excessive debt, which means OSH still has room to improve shareholder returns by raising debt to fund new investments.
Are you a potential investor? If you are considering investing in OSH, looking at ROE on its own is not enough to make a well-informed decision. I recommend you do additional fundamental analysis by looking through our most recent infographic report on Oil Search to help you make a more informed investment decision. If you are not interested in OSH anymore, you can use our free platform to see our list of stocks with Return on Equity over 20%.
To help readers see pass the short term volatility of the financial market, we aim to bring you a long-term focused research analysis purely driven by fundamental data. Note that our analysis does not factor in the latest price sensitive company announcements.
The author is an independent contributor and at the time of publication had no position in the stocks mentioned.
