What You Must Know About Talgo SA’s (BME:TLGO) Financial Strength

Investors are always looking for growth in small-cap stocks like Talgo SA (BME:TLGO), with a market cap of €673.83m. However, an important fact which most ignore is: how financially healthy is the business? So, understanding the company’s financial health becomes vital, as mismanagement of capital can lead to bankruptcies, which occur at a higher rate for small-caps. Here are few basic financial health checks you should consider before taking the plunge. Nevertheless, since I only look at basic financial figures, I suggest you dig deeper yourself into TLGO here.
Does TLGO produce enough cash relative to debt?
TLGO has built up its total debt levels in the last twelve months, from €252.67m to €0 , which is made up of current and long term debt. With this growth in debt, the current cash and short-term investment levels stands at €243.23m , ready to deploy into the business. Moreover, TLGO has generated cash from operations of €184.87m during the same period of time, resulting in an operating cash to total debt ratio of 62.11%, meaning that TLGO’s current level of operating cash is high enough to cover debt. This ratio can also be a sign of operational efficiency as an alternative to return on assets. In TLGO’s case, it is able to generate 0.62x cash from its debt capital.
Does TLGO’s liquid assets cover its short-term commitments?
Looking at TLGO’s most recent €219.40m liabilities, the company has been able to meet these commitments with a current assets level of €569.41m, leading to a 2.6x current account ratio. Generally, for Machinery companies, this is a reasonable ratio as there’s enough of a cash buffer without holding too capital in low return investments.
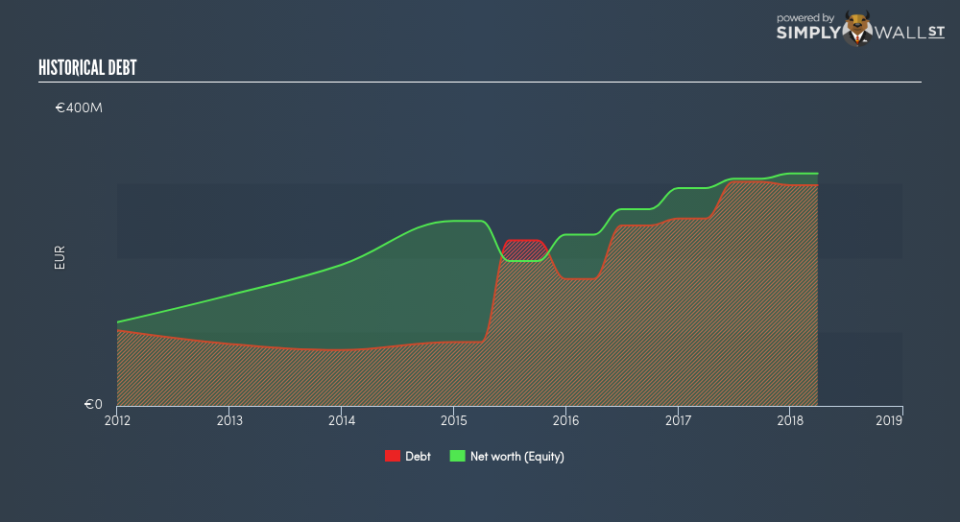
Is TLGO’s debt level acceptable?
TLGO is a relatively highly levered company with a debt-to-equity of 94.94%. This is not uncommon for a small-cap company given that debt tends to be lower-cost and at times, more accessible. We can test if TLGO’s debt levels are sustainable by measuring interest payments against earnings of a company. Ideally, earnings before interest and tax (EBIT) should cover net interest by at least three times. For TLGO, the ratio of 5.15x suggests that interest is appropriately covered, which means that lenders may be less hesitant to lend out more funding as TLGO’s high interest coverage is seen as responsible and safe practice.
Next Steps:
TLGO’s high cash coverage means that, although its debt levels are high, the company is able to utilise its borrowings efficiently in order to generate cash flow. This may mean this is an optimal capital structure for the business, given that it is also meeting its short-term commitment. I admit this is a fairly basic analysis for TLGO’s financial health. Other important fundamentals need to be considered alongside. You should continue to research Talgo to get a more holistic view of the small-cap by looking at:
Future Outlook: What are well-informed industry analysts predicting for TLGO’s future growth? Take a look at our free research report of analyst consensus for TLGO’s outlook.
Valuation: What is TLGO worth today? Is the stock undervalued, even when its growth outlook is factored into its intrinsic value? The intrinsic value infographic in our free research report helps visualize whether TLGO is currently mispriced by the market.
Other High-Performing Stocks: Are there other stocks that provide better prospects with proven track records? Explore our free list of these great stocks here.
To help readers see pass the short term volatility of the financial market, we aim to bring you a long-term focused research analysis purely driven by fundamental data. Note that our analysis does not factor in the latest price sensitive company announcements.
The author is an independent contributor and at the time of publication had no position in the stocks mentioned.
