What You Must Know About Williams-Sonoma Inc’s (NYSE:WSM) Financial Health

Small-caps and large-caps are wildly popular among investors, however, mid-cap stocks, such as Williams-Sonoma Inc (NYSE:WSM), with a market capitalization of US$4.95b, rarely draw their attention from the investing community. Surprisingly though, when accounted for risk, mid-caps have delivered better returns compared to the two other categories of stocks. WSM’s financial liquidity and debt position will be analysed in this article, to get an idea of whether the company can fund opportunities for strategic growth and maintain strength through economic downturns. Note that this information is centred entirely on financial health and is a top-level understanding, so I encourage you to look further into WSM here.
See our latest analysis for Williams-Sonoma
How much cash does WSM generate through its operations?
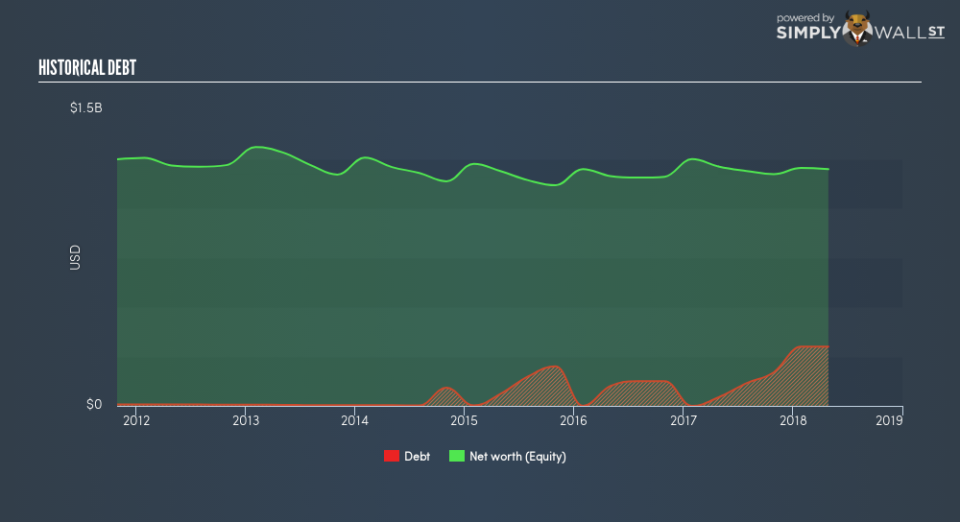
WSM’s debt levels surged from US$45.00m to US$299.47m over the last 12 months , which is made up of current and long term debt. With this growth in debt, WSM’s cash and short-term investments stands at US$290.24m for investing into the business. On top of this, WSM has produced cash from operations of US$556.85m during the same period of time, leading to an operating cash to total debt ratio of 185.94%, meaning that WSM’s operating cash is sufficient to cover its debt. This ratio can also be a sign of operational efficiency as an alternative to return on assets. In WSM’s case, it is able to generate 1.86x cash from its debt capital.
Does WSM’s liquid assets cover its short-term commitments?
With current liabilities at US$882.82m, it appears that the company has been able to meet these obligations given the level of current assets of US$1.52b, with a current ratio of 1.73x. Generally, for Specialty Retail companies, this is a reasonable ratio since there is a bit of a cash buffer without leaving too much capital in a low-return environment.
Is WSM’s debt level acceptable?
With a debt-to-equity ratio of 25.01%, WSM’s debt level may be seen as prudent. This range is considered safe as WSM is not taking on too much debt obligation, which can be restrictive and risky for equity-holders. We can test if WSM’s debt levels are sustainable by measuring interest payments against earnings of a company. Ideally, earnings before interest and tax (EBIT) should cover net interest by at least three times. For WSM, the ratio of 175x suggests that interest is comfortably covered, which means that lenders may be less hesitant to lend out more funding as WSM’s high interest coverage is seen as responsible and safe practice.
Next Steps:
WSM’s high cash coverage and appropriate debt levels indicate its ability to utilise its borrowings efficiently in order to generate ample cash flow. Furthermore, the company exhibits proper management of current assets and upcoming liabilities. I admit this is a fairly basic analysis for WSM’s financial health. Other important fundamentals need to be considered alongside. You should continue to research Williams-Sonoma to get a more holistic view of the stock by looking at:
Future Outlook: What are well-informed industry analysts predicting for WSM’s future growth? Take a look at our free research report of analyst consensus for WSM’s outlook.
Valuation: What is WSM worth today? Is the stock undervalued, even when its growth outlook is factored into its intrinsic value? The intrinsic value infographic in our free research report helps visualize whether WSM is currently mispriced by the market.
Other High-Performing Stocks: Are there other stocks that provide better prospects with proven track records? Explore our free list of these great stocks here.
To help readers see past the short term volatility of the financial market, we aim to bring you a long-term focused research analysis purely driven by fundamental data. Note that our analysis does not factor in the latest price-sensitive company announcements.
The author is an independent contributor and at the time of publication had no position in the stocks mentioned. For errors that warrant correction please contact the editor at editorial-team@simplywallst.com.
