What You Must Know About Yara International ASA’s (OB:YAR) 4.38% ROE

I am writing today to help inform people who are new to the stock market and want to better understand how you can grow your money by investing in Yara International ASA (OB:YAR).
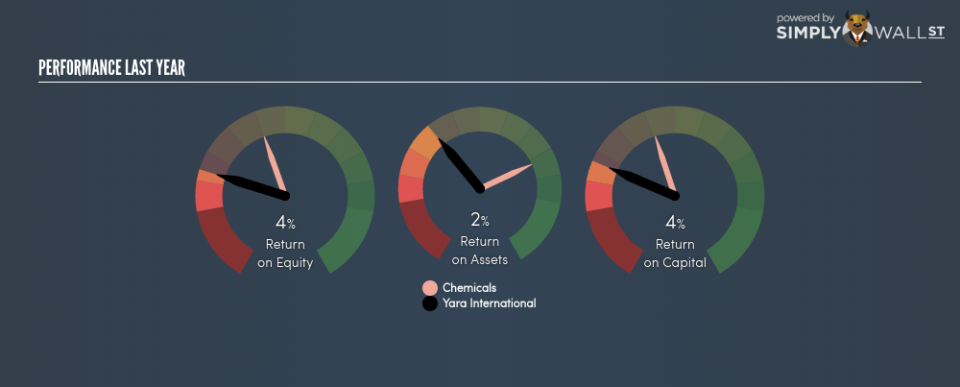
Yara International ASA (OB:YAR) delivered a less impressive 4.38% ROE over the past year, compared to the 13.19% return generated by its industry. YAR’s results could indicate a relatively inefficient operation to its peers, and while this may be the case, it is important to understand what ROE is made up of and how it should be interpreted. Knowing these components could change your view on YAR’s performance. I will take you through how metrics such as financial leverage impact ROE which may affect the overall sustainability of YAR’s returns. Check out our latest analysis for Yara International
What you must know about ROE
Return on Equity (ROE) is a measure of Yara International’s profit relative to its shareholders’ equity. An ROE of 4.38% implies NOK0.044 returned on every NOK1 invested. Generally speaking, a higher ROE is preferred; however, there are other factors we must also consider before making any conclusions.
Return on Equity = Net Profit ÷ Shareholders Equity
Returns are usually compared to costs to measure the efficiency of capital. Yara International’s cost of equity is 9.75%. Given a discrepancy of -5.37% between return and cost, this indicated that Yara International may be paying more for its capital than what it’s generating in return. ROE can be broken down into three different ratios: net profit margin, asset turnover, and financial leverage. This is called the Dupont Formula:
Dupont Formula
ROE = profit margin × asset turnover × financial leverage
ROE = (annual net profit ÷ sales) × (sales ÷ assets) × (assets ÷ shareholders’ equity)
ROE = annual net profit ÷ shareholders’ equity
Basically, profit margin measures how much of revenue trickles down into earnings which illustrates how efficient the business is with its cost management. Asset turnover shows how much revenue Yara International can generate with its current asset base. And finally, financial leverage is simply how much of assets are funded by equity, which exhibits how sustainable the company’s capital structure is. Since financial leverage can artificially inflate ROE, we need to look at how much debt Yara International currently has. At 34.98%, Yara International’s debt-to-equity ratio appears low and indicates that Yara International still has room to increase leverage and grow its profits.

Next Steps:
While ROE is a relatively simple calculation, it can be broken down into different ratios, each telling a different story about the strengths and weaknesses of a company. Yara International’s ROE is underwhelming relative to the industry average, and its returns were also not strong enough to cover its own cost of equity. Although, its appropriate level of leverage means investors can be more confident in the sustainability of Yara International’s return with a possible increase should the company decide to increase its debt levels. Although ROE can be a useful metric, it is only a small part of diligent research.
For Yara International, I’ve put together three fundamental factors you should further research:
Financial Health: Does it have a healthy balance sheet? Take a look at our free balance sheet analysis with six simple checks on key factors like leverage and risk.
Valuation: What is Yara International worth today? Is the stock undervalued, even when its growth outlook is factored into its intrinsic value? The intrinsic value infographic in our free research report helps visualize whether Yara International is currently mispriced by the market.
Other High-Growth Alternatives : Are there other high-growth stocks you could be holding instead of Yara International? Explore our interactive list of stocks with large growth potential to get an idea of what else is out there you may be missing!
To help readers see pass the short term volatility of the financial market, we aim to bring you a long-term focused research analysis purely driven by fundamental data. Note that our analysis does not factor in the latest price sensitive company announcements.
The author is an independent contributor and at the time of publication had no position in the stocks mentioned.
