Nelnet (NYSE:NNI) stock performs better than its underlying earnings growth over last three years
By buying an index fund, investors can approximate the average market return. But if you choose individual stocks with prowess, you can make superior returns. For example, the Nelnet, Inc. (NYSE:NNI) share price is up 79% in the last three years, clearly besting the market return of around 27% (not including dividends). However, more recent returns haven't been as impressive as that, with the stock returning just 15% in the last year , including dividends .
The past week has proven to be lucrative for Nelnet investors, so let's see if fundamentals drove the company's three-year performance.
View our latest analysis for Nelnet
There is no denying that markets are sometimes efficient, but prices do not always reflect underlying business performance. By comparing earnings per share (EPS) and share price changes over time, we can get a feel for how investor attitudes to a company have morphed over time.
Nelnet was able to grow its EPS at 64% per year over three years, sending the share price higher. This EPS growth is higher than the 22% average annual increase in the share price. So it seems investors have become more cautious about the company, over time.
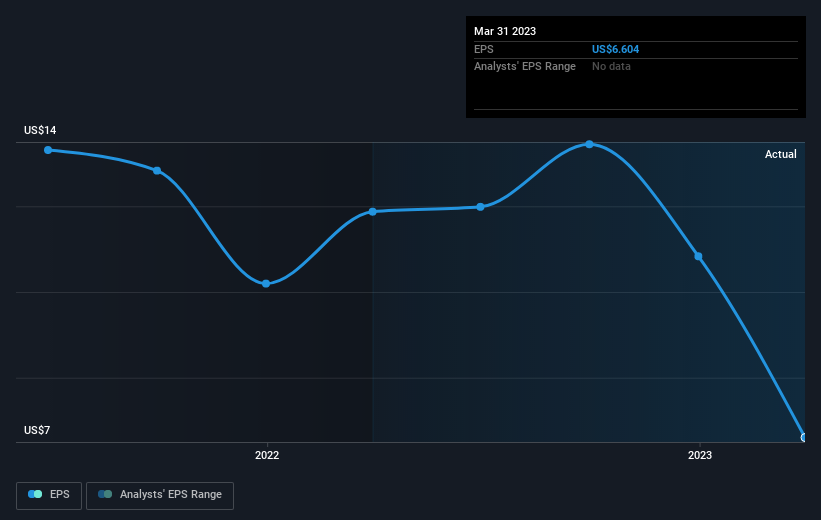
You can see below how EPS has changed over time (discover the exact values by clicking on the image).
We're pleased to report that the CEO is remunerated more modestly than most CEOs at similarly capitalized companies. It's always worth keeping an eye on CEO pay, but a more important question is whether the company will grow earnings throughout the years. It might be well worthwhile taking a look at our free report on Nelnet's earnings, revenue and cash flow.
What About Dividends?
It is important to consider the total shareholder return, as well as the share price return, for any given stock. Whereas the share price return only reflects the change in the share price, the TSR includes the value of dividends (assuming they were reinvested) and the benefit of any discounted capital raising or spin-off. So for companies that pay a generous dividend, the TSR is often a lot higher than the share price return. In the case of Nelnet, it has a TSR of 86% for the last 3 years. That exceeds its share price return that we previously mentioned. And there's no prize for guessing that the dividend payments largely explain the divergence!
A Different Perspective
We're pleased to report that Nelnet shareholders have received a total shareholder return of 15% over one year. That's including the dividend. Since the one-year TSR is better than the five-year TSR (the latter coming in at 11% per year), it would seem that the stock's performance has improved in recent times. Someone with an optimistic perspective could view the recent improvement in TSR as indicating that the business itself is getting better with time. It's always interesting to track share price performance over the longer term. But to understand Nelnet better, we need to consider many other factors. For example, we've discovered 2 warning signs for Nelnet (1 is concerning!) that you should be aware of before investing here.
Of course Nelnet may not be the best stock to buy. So you may wish to see this free collection of growth stocks.
Please note, the market returns quoted in this article reflect the market weighted average returns of stocks that currently trade on American exchanges.
Have feedback on this article? Concerned about the content? Get in touch with us directly. Alternatively, email editorial-team (at) simplywallst.com.
This article by Simply Wall St is general in nature. We provide commentary based on historical data and analyst forecasts only using an unbiased methodology and our articles are not intended to be financial advice. It does not constitute a recommendation to buy or sell any stock, and does not take account of your objectives, or your financial situation. We aim to bring you long-term focused analysis driven by fundamental data. Note that our analysis may not factor in the latest price-sensitive company announcements or qualitative material. Simply Wall St has no position in any stocks mentioned.
Join A Paid User Research Session
You’ll receive a US$30 Amazon Gift card for 1 hour of your time while helping us build better investing tools for the individual investors like yourself. Sign up here
