Neogen (NEOG)'s Hidden Bargain: An In-Depth Look at the 25% Margin of Safety Based on its Valuation
Neogen Corp (NASDAQ:NEOG) experienced a daily loss of -8.25% and a 3-month gain of 5.24%. Despite a reported Loss Per Share of $0.07, the stock is considered significantly undervalued. This article aims to delve into the valuation analysis of Neogen, providing a comprehensive understanding of its intrinsic value and growth potential.
Company Overview
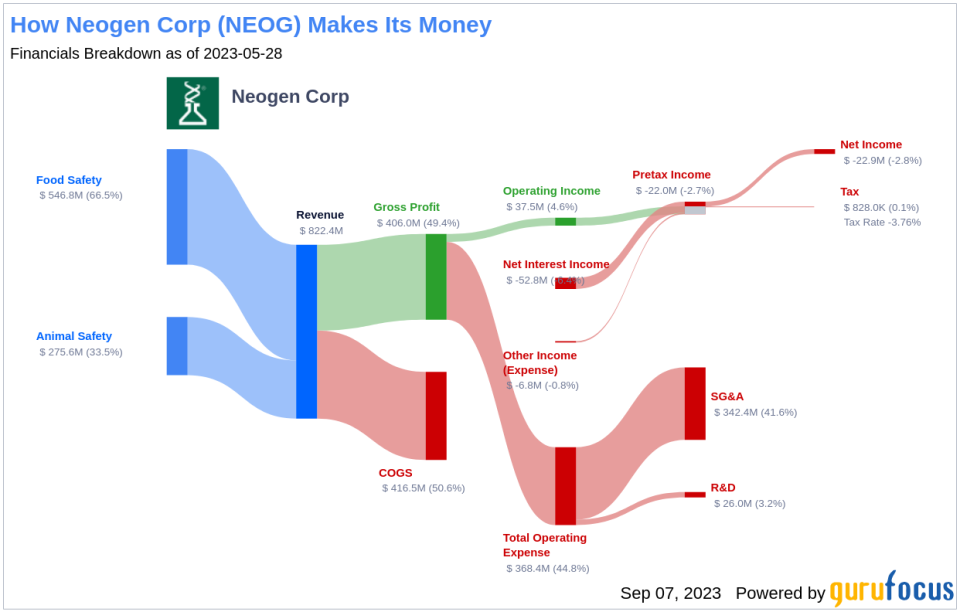
Headquartered in Lansing, Michigan, Neogen Corp develops, manufactures, and markets a diverse range of products for food and animal safety. The company's diagnostics detect unintended substances in food and animal feed, such as pathogens, allergens, and drug residues, for food and feed processing companies. Additionally, Neogen sells veterinary instruments, pharmaceuticals, disinfectants, and genomics tests for animals, including cattle, horses, and canines. The United States accounts for 60% of total revenue, with international markets making up the remaining 40%.
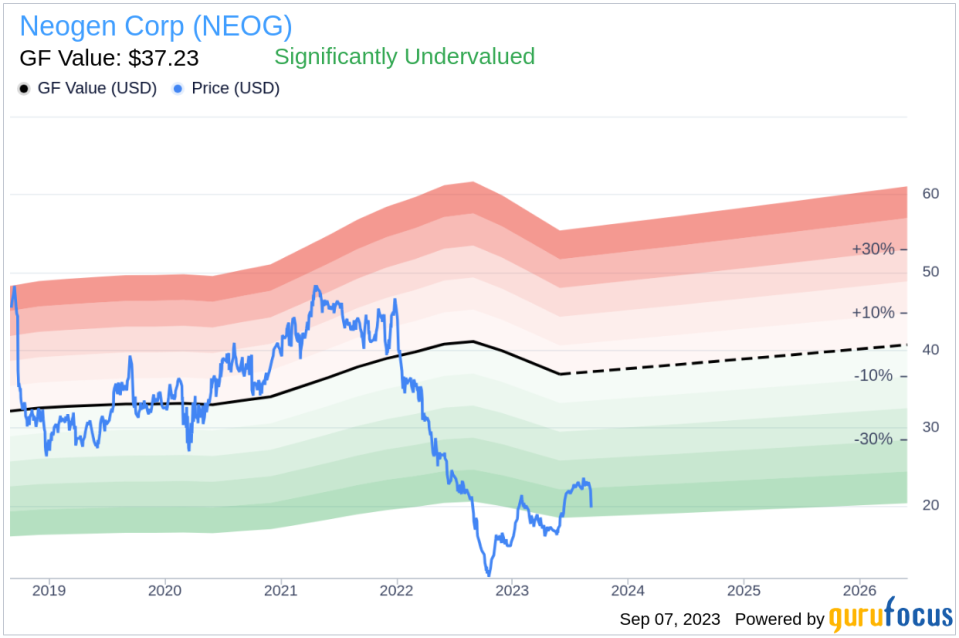
Currently trading at $20.47 per share, Neogen has a market cap of $4.40 billion. When compared to its GF Value of $37.23, the stock appears significantly undervalued, suggesting a promising future return.
Understanding GF Value
The GF Value represents the current intrinsic value of a stock, derived from a unique method that considers historical trading multiples, a GuruFocus adjustment factor based on past returns and growth, and future business performance estimates. The GF Value Line provides an overview of the fair value at which the stock should ideally be traded. If the stock price is significantly above the GF Value Line, it is overvalued, and its future return is likely to be poor. Conversely, if it is significantly below the GF Value Line, its future return will likely be higher.
Neogen's current stock price suggests that it is significantly undervalued. As such, the long-term return of its stock is likely to be much higher than its business growth.
Financial Strength
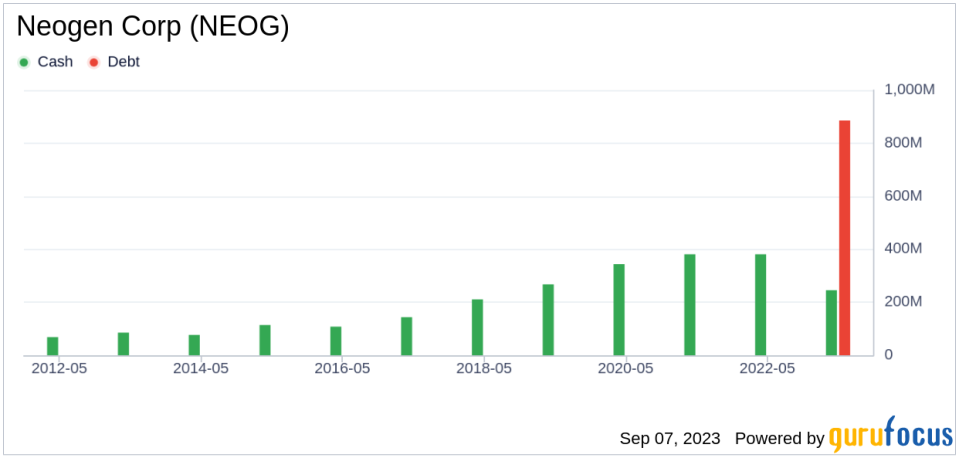
Investing in companies with poor financial strength can lead to a higher risk of permanent loss of capital. Thus, it is crucial to review the financial strength of a company before deciding whether to buy its stock. A good starting point for understanding a company's financial strength is its cash-to-debt ratio. Neogen has a cash-to-debt ratio of 0.28, which is worse than 76.75% of 228 companies in the Medical Diagnostics & Research industry. Despite this, Neogen's overall financial strength is ranked 6 out of 10, indicating fair financial health.
Profitability and Growth
Companies that have consistently shown profitability over the long term offer less risk for investors who may want to purchase shares. Higher profit margins usually dictate a better investment compared to a company with lower profit margins. Neogen has been profitable 9 out of the past 10 years, with a revenue of $822.50 million and a Loss Per Share of $0.07 over the past twelve months. Its operating margin is 4.56%, ranking better than 58.04% of 224 companies in the Medical Diagnostics & Research industry. Overall, the profitability of Neogen is ranked 7 out of 10, indicating fair profitability.
One of the most important factors in the valuation of a company is growth. Companies that grow faster create more value for shareholders, especially if that growth is profitable. The average annual revenue growth of Neogen is 3.3%, which ranks worse than 66.67% of 204 companies in the Medical Diagnostics & Research industry. The 3-year average EBITDA growth is -7.3%, ranking worse than 73.4% of 188 companies in the same industry.
ROIC vs WACC
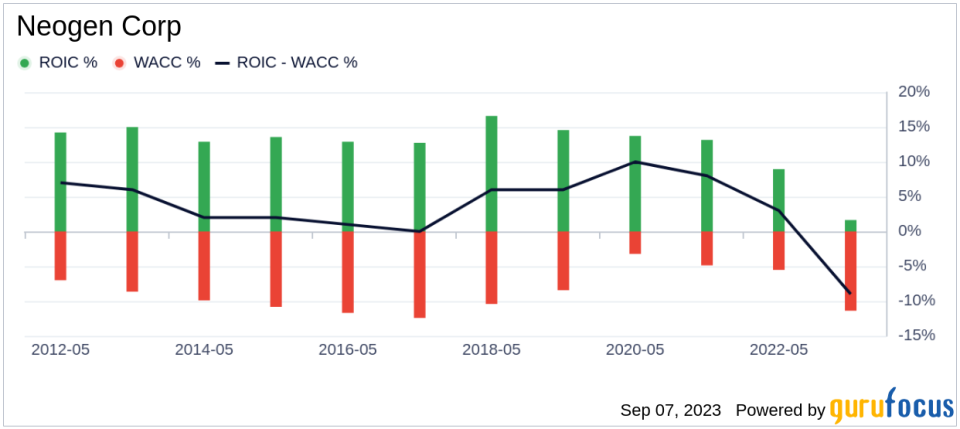
Another way to assess the profitability of a company is to compare its return on invested capital (ROIC) and the weighted cost of capital (WACC). The ROIC measures how well a company generates cash flow relative to the capital it has invested in its business. The WACC is the rate that a company is expected to pay on average to all its security holders to finance its assets. Ideally, the ROIC should be higher than the WACC. For the past 12 months, Neogen's ROIC is 1.42, and its WACC is 13.54.
Conclusion
In summary, Neogen's stock shows every sign of being significantly undervalued. The company's financial condition is fair, and its profitability is fair. However, its growth ranks worse than 73.4% of 188 companies in the Medical Diagnostics & Research industry. To learn more about Neogen stock, you can check out its 30-Year Financials here.
To find out the high-quality companies that may deliver above-average returns, please check out GuruFocus High Quality Low Capex Screener.
This article first appeared on GuruFocus.
