Is NeuroMetrix (NURO) Too Good to Be True? A Comprehensive Analysis of a Potential Value Trap
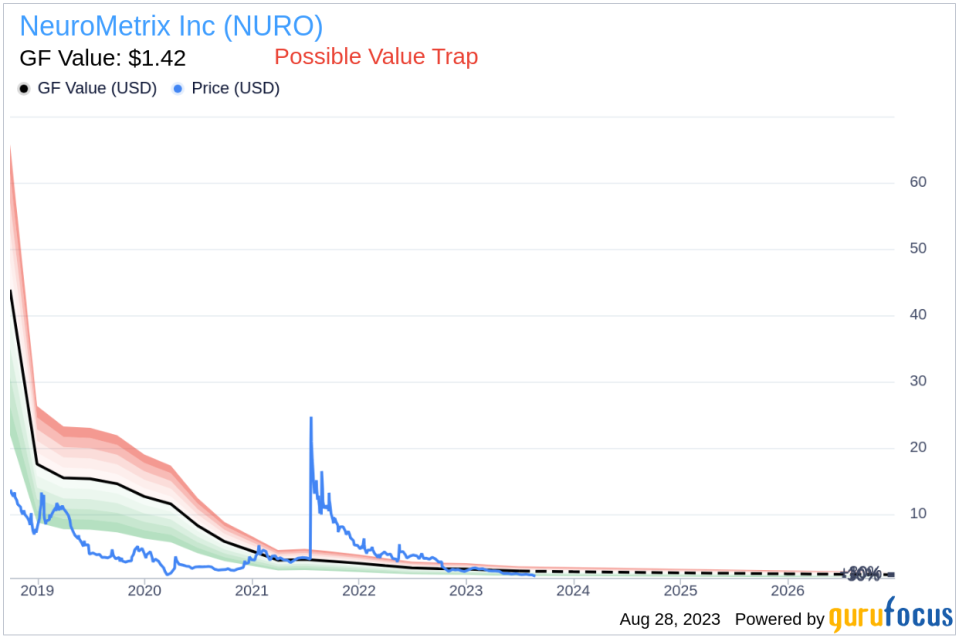
Value-focused investors are always on the hunt for stocks that are priced below their intrinsic value. One such stock that merits attention is NeuroMetrix Inc (NASDAQ:NURO). The stock, which is currently priced at 0.79, recorded a gain of 19.55% in a day and a 3-month decrease of 30.78%. The stock's fair valuation is $1.42, as indicated by its GF Value.
Understanding GF Value
The GF Value represents the current intrinsic value of a stock derived from our exclusive method. The GF Value Line on our summary page gives an overview of the fair value that the stock should be traded at. It is calculated based on three factors: historical multiples (PE Ratio, PS Ratio, PB Ratio and Price-to-Free-Cash-Flow) that the stock has traded at, GuruFocus adjustment factor based on the company's past returns and growth, and future estimates of the business performance.
We believe the GF Value Line is the fair value that the stock should be traded at. The stock price will most likely fluctuate around the GF Value Line. If the stock price is significantly above the GF Value Line, it is overvalued and its future return is likely to be poor. On the other hand, if it is significantly below the GF Value Line, its future return will likely be higher.
Digging Deeper: The Risks
However, investors need to consider a more in-depth analysis before making an investment decision. Despite its seemingly attractive valuation, certain risk factors associated with NeuroMetrix should not be ignored. These risks are primarily reflected through its low Altman Z-score of -9.57, and the company's revenues and earnings have been on a downward trend over the past five years, which raises a crucial question: Is NeuroMetrix a hidden gem or a value trap? These indicators suggest that NeuroMetrix, despite its apparent undervaluation, might be a potential value trap. This complexity underlines the importance of thorough due diligence in investment decision-making.
Altman Z-score: A Quick Primer
Before delving into the details, let's understand what the Altman Z-score entails. Invented by New York University Professor Edward I. Altman in 1968, the Z-Score is a financial model that predicts the probability of a company entering bankruptcy within a two-year time frame. The Altman Z-Score combines five different financial ratios, each weighted to create a final score. A score below 1.8 suggests a high likelihood of financial distress, while a score above 3 indicates a low risk.
NeuroMetrix: A Company Overview
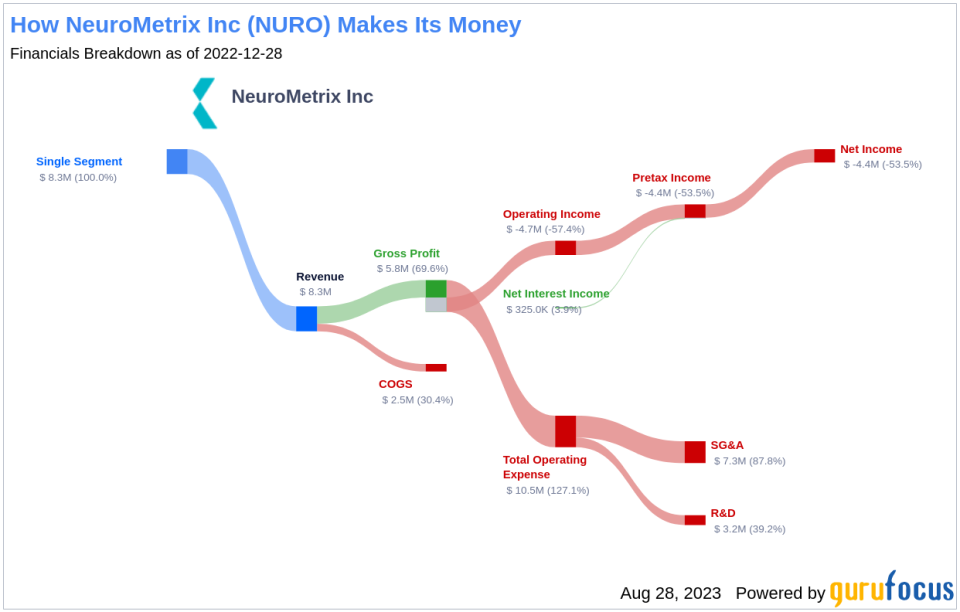
NeuroMetrix Inc is a commercial-stage healthcare company. Its core business activities are integrated with in-house capabilities spanning product development, manufacturing, regulatory affairs and compliance, sales and marketing, and customer support. The company produces bioelectrical and digital medicine to address chronic health conditions including chronic pain, sleep disorders, and diabetes. The product line of the company includes Wearable neuro-stimulation therapeutic devices and Point-of-care neuropathy diagnostic tests. The company operates in a single segment being Medical equipment and consumables.
NeuroMetrix's Low Altman Z-Score: A Breakdown of Key Drivers
A dissection of NeuroMetrix's Altman Z-score reveals NeuroMetrix's financial health may be weak, suggesting possible financial distress:
The first factor we need to consider is a measure of short-term liquidity. This is calculated as the working capital divided by total assets. When we evaluate the data provided: 2021: 0.13; 2022: 0.12; 2023: 0.11, it's clear that NeuroMetrix has experienced a recent decline following an initial increase in its Working Capital to Total Assets ratio over the past few years. This decline suggests potential liquidity issues that the company may be facing. The ratio is strikingly low, which unfavorably influences the overall Z-Score.
The EBIT to Total Assets ratio serves as a crucial barometer of a company's operational effectiveness, correlating earnings before interest and taxes (EBIT) to total assets. An analysis of NeuroMetrix's EBIT to Total Assets ratio from historical data (2021: -0.11; 2022: -0.15; 2023: -0.26) indicates a recent dip following an initial rise. This reduction suggests that NeuroMetrix might not be utilizing its assets to their full potential to generate operational profits, which could be negatively affecting the company's overall Z-score.
Operational Efficiency: Asset Turnover
When it comes to operational efficiency, a vital indicator for NeuroMetrix is its asset turnover. The data: 2021: 0.95; 2022: 0.37; 2023: 0.30 from the past three years suggests a decreasing trend in this ratio. The asset turnover ratio reflects how effectively a company is using its assets to generate sales. Therefore, a drop in this ratio can signify reduced operational efficiency, potentially due to underutilization of assets or decreased market demand for the company's products or services. This shift in NeuroMetrix's asset turnover underlines the need for the company to reassess its operational strategies to optimize asset usage and boost sales.
The Bearish Signs: Declining Revenues and Earnings
One of the telltale indicators of a company's potential trouble is a sustained decline in revenues. In the case of NeuroMetrix, both the revenue per share (evident from the last five years' TTM data: 2019: 10.14; 2020: 5.48; 2021: 2.11; 2022: 1.27; 2023: 0.96; ) and the 5-year revenue growth rate (-57.1%) have been on a consistent downward trajectory. This pattern may point to underlying challenges such as diminishing demand for NeuroMetrix's products, or escalating competition in its market sector. Either scenario can pose serious risks to the company's future performance, warranting a thorough analysis by investors.
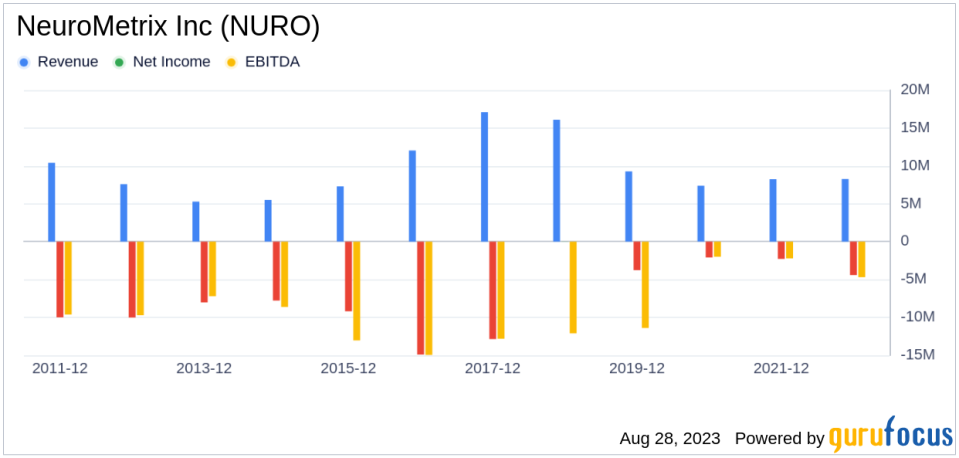
The Red Flag: Sluggish Earnings Growth
Despite its low price-to-fair-value ratio, NeuroMetrix's falling revenues and earnings cast a long shadow over its investment attractiveness. A low price relative to intrinsic value can indeed suggest an investment opportunity, but only if the company's fundamentals are sound or improving. In NeuroMetrix's case, the declining revenues, EBITDA, and earnings growth suggest that the company's issues may be more than just cyclical fluctuations.
Without a clear turnaround strategy, there's a risk that the company's performance could continue to deteriorate, leading to further price declines. In such a scenario, the low price-to-GF-Value ratio may be more indicative of a value trap than a value opportunity.
Conclusion: A Potential Value Trap
Given the multitude of risk factors, including declining revenues, earnings, and a low Altman Z-score, NeuroMetrix may be a potential value trap. While its current price is below the GF Value, the company's weak financial health and operational inefficiencies could lead to further price declines. This complexity underlines the importance of thorough due diligence in investment decision-making. Therefore, while NeuroMetrix may seem like a bargain, investors should tread carefully and consider the potential risks before investing.
GuruFocus Premium members can find stocks with high Altman Z-Score using the following Screener: Walter Schloss Screen .Investors can find stocks with good revenue and earnings growth using GuruFocus' Peter Lynch Growth with Low Valuation Screener.
This article first appeared on GuruFocus.
