News Corporation (NWSA) Q1 Earnings Beat, Revenues Rise Y/Y
News Corporation NWSA reported first-quarter fiscal 2024 earnings of 16 cents per share, which beat the Zacks Consensus Estimate by 45.45% but declined 33.3% year over year.
Revenues of $2.49 billion increased 0.8% year over year and beat the consensus mark by 0.27%. The increase was primarily driven by a rise in physical book sales and improved returns in the Book Publishing segment. The segment’s returns benefited from the absence of Amazon’s reset in the prior year and higher revenues at the Dow Jones segment, backed by robust growth in its professional information business.
The improvement was partly offset by lower revenues in the Digital Real Estate Services segment due to continued challenging housing market conditions in the United States, a $14 million negative impact from foreign currency fluctuations and lower advertising revenues in the News Media segment.
News Corporation Price, Consensus and EPS Surprise
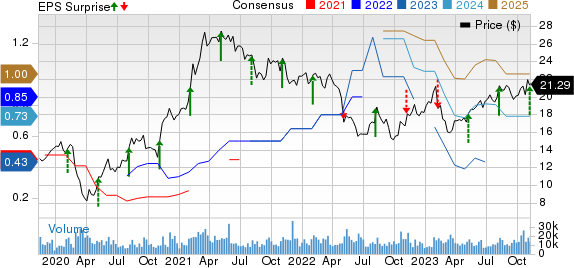
News Corporation price-consensus-eps-surprise-chart | News Corporation Quote
Quarterly Details
Adjusted Revenues (which exclude the foreign currency impact, acquisitions and divestitures) were up 1% compared with the prior-year period.
Total EBITDA increased 4% to $364 million, primarily due to higher revenues and gross cost savings related to the announced 5% headcount reduction initiative. The increase was partly offset by higher costs for sports programming rights in the Subscription Video Services segment, improved technology and employee costs at the Dow Jones segment and increased employee costs in the Book Publishing segment.
Segment Details
Digital Real Estate Services
Revenues in the Digital Real Estate Services segment declined 4% to $403 million, induced by a 2% negative impact from foreign currency fluctuations. Adjusted segment revenues decreased 2%.
Revenues in Move fell 16% to $142 million, primarily as a result of lower real estate revenues. Notably, real estate revenues, which represented 80% of total Move revenues, decreased 20% year over year. The decline was due to the continued impact of the macroeconomic environment on the housing market, including higher mortgage rates, which has led to lower lead and transaction volumes.
The referral model generated 25% of total Move revenues in the quarter compared with 31% in the prior year. Based on Move’s internal data, average monthly unique users of Realtor.com’s web and mobile sites declined 20% year over year to 74 million. Lead volume declined 14%.
Revenues at REA Group rose 4% to $261 million, driven by higher Australian residential revenues due to price increases, improved depth penetration and a surge in national listings, as well as 25% higher revenues from REA India.
The increase was partly offset by a 4% negative impact from foreign currency fluctuations and $4 million of lower financial services revenues due to a decrease in settlement activity.
Australian national residential buy listing volumes in the quarter increased 1% compared with the prior year, with listings in Sydney and Melbourne up 16% and 14%, respectively.
Subscription Video Services
The Subscription Video Services segment’s revenues were $486 million, down 3% year over year. Foreign currency fluctuations adversely impacted the segment’s revenues by 4%. Higher revenues from Kayo and BINGE, driven by a rise in both volume and pricing, were partially offset by the impact from fewer residential broadcast subscribers.
Foxtel Group streaming subscription revenues represented approximately 30% of total circulation and subscription revenues in the quarter, as compared with 25% in the prior year. As of Sep 30, 2023, Foxtel’s total closing paid subscribers were nearly 4.6 million, reflecting a 2% increase compared with the prior year, primarily due to the growth in streaming subscribers driven by Kayo and BINGE, partially offset by fewer residential broadcast subscribers.
Broadcast subscriber churn in the quarter improved to 11.4% compared with 14.2% in the prior year. Broadcast ARPU for the quarter increased 3% year over year to A$85 (US$56).
Dow Jones
Revenues at the Dow Jones segment increased 4% year over year to $537 million, driven by growth in circulation and subscription revenues led by a rise in professional information business products. Digital revenues at Dow Jones in the quarter represented 81% of total revenues compared with 79% in the prior year. Adjusted Revenues increased 3%.
Circulation and subscription revenues increased 5%, including 1% positive impact from foreign currency fluctuations. Professional information business revenues grew 14%, primarily due to 23% growth in Risk & Compliance revenues, driven by both financial and corporate customers, and a 20% rise in Dow Jones Energy revenues (which includes OPIS and CMA) as a result of price increases, new products and customers and a modest benefit from new events and one-time items.
Circulation revenues increased 1%, primarily due to the continued growth in digital-only subscriptions, which helped as a result of bundling, partially offset by lower print volume. Digital circulation revenues accounted for 70% of circulation revenues for the quarter compared with 68% in the prior year.
Advertising revenues decreased 3%, primarily due to 6% and 2% declines in print and digital advertising revenues, respectively. Digital advertising accounted for 66% of total advertising revenues in the quarter compared with 65% in the prior year.
During the first quarter, total average subscriptions to Dow Jones’ consumer products reached 5.3 million, representing an 8% increase compared with the prior year. Digital-only subscriptions to Dow Jones’ consumer products grew 12%.
Total subscriptions to The Wall Street Journal grew 6% compared with the prior year to 4 million average subscriptions in the quarter. Digital-only subscriptions to The Wall Street Journal grew 10% to more than 3.4 million average subscriptions in the quarter and represented 87% of total The Wall Street Journal subscriptions.
Book Publishing
The Book Publishing segment reported revenues of $525 million, which increased 8% year over year from the prior-year fiscal quarter’s level, primarily driven by a rise in physical book sales and improved returns in the United States resulting from the absence of the impact of Amazon’s reset of its inventory levels and rightsizing of its warehouse footprint in the prior year. Adjusted revenues increased 6%.
Key titles in the quarter included Tom Lake by Ann Patchett, Demon Copperhead by Barbara Kingsolver and The Collector by Daniel Silva.
Digital sales increased 3% compared with the prior year. Digital sales represented 22% of Consumer revenues for the quarter compared with 23% in the prior year. Backlist sales represented approximately 61% of total revenues in the quarter compared with 65% in the prior year.
News Media
Revenues in the News Media segment dipped 1% to $548 million, primarily due to lower advertising revenues, partially offset by 1% positive impact from foreign currency fluctuations and higher circulation and subscription revenues. Adjusted revenues for the segment decreased 2% compared with the prior year.
Within the segment, revenues at News Corp Australia decreased 7% due to a 5% negative impact from foreign currency fluctuations and lower advertising revenues, while News UK increased 3%, driven by the 7% positive impact from foreign currency fluctuations.
Circulation and subscription revenues increased 2% compared with the prior year, primarily due to a 2% positive impact from foreign currency fluctuations, price increases and digital subscriber growth, partially offset by lower print volumes.
Advertising revenues decreased 5% compared with the prior year, primarily due to lower print and digital advertising at News Corp Australia, lower print advertising at News UK and a decline in traffic at some mastheads due to platform-related changes. The decline was partially offset by a 1% positive impact from foreign currency fluctuations.
Digital revenues represented 37% of News Media segment revenues in the quarter compared with 36% in the prior year and represented 35% of the combined revenues of the newspaper mastheads.
As of Sep 30, 2023, The Times and Sunday Times closing digital subscribers, including the Times Literary Supplement, were 572K compared with 532K in the prior year. New York Post’s digital network reached 127 million unique users in September 2023 compared with 151 million in the prior year.
Other Financial Aspects
News Corporation ended the quarter with cash and cash equivalents of $1,529 million, borrowings of $2,909 million and a stockholders’ equity of $7,892 million, excluding non-controlling interest of $844 million.
Net cash used by operating activities amounted to $55 million during the first quarter of fiscal 2024. NWSA incurred capital expenditures of $124 million in the said period. Free cash flow available to News Corporation was $(174) million.
Zacks Rank & Stocks to Consider
NWSA currently has a Zacks Rank #3 (Hold).
NetEase NTES, AST SpaceMobile ASTS and Genius Sports Limited GENI are some better-ranked stocks that investors can consider in the broader sector. While NTES sports a Zacks Rank #1 (Strong Buy), ASTS and GENI carry a Zacks Rank #2 (Buy) each at present. You can see the complete list of today’s Zacks #1 Rank stocks here.
Shares of NetEase have gained 54.4% year to date. NTES is set to report its third-quarter 2023 results on Nov 16.
Shares of AST SpaceMobile have declined 15.1% year to date. ASTS is slated to report its third-quarter 2023 results on Nov 13.
Shares of Genius Sports Limited have gained 49.9% year to date. GENI is set to report its third-quarter 2023 results on Nov 13.
Want the latest recommendations from Zacks Investment Research? Today, you can download 7 Best Stocks for the Next 30 Days. Click to get this free report
News Corporation (NWSA) : Free Stock Analysis Report
NetEase, Inc. (NTES) : Free Stock Analysis Report
AST SpaceMobile, Inc. (ASTS) : Free Stock Analysis Report
Genius Sports Limited (GENI) : Free Stock Analysis Report
