NexPoint Real Estate Finance (NYSE:NREF) investors are sitting on a loss of 10% if they invested a year ago
It's understandable if you feel frustrated when a stock you own sees a lower share price. But in the short term the market is a voting machine, and the share price movements may not reflect the underlying business performance. The NexPoint Real Estate Finance, Inc. (NYSE:NREF) is down 19% over a year, but the total shareholder return is -10% once you include the dividend. That's better than the market which declined 24% over the last year. Because NexPoint Real Estate Finance hasn't been listed for many years, the market is still learning about how the business performs. Unfortunately the share price momentum is still quite negative, with prices down 14% in thirty days.
Now let's have a look at the company's fundamentals, and see if the long term shareholder return has matched the performance of the underlying business.
Check out our latest analysis for NexPoint Real Estate Finance
While the efficient markets hypothesis continues to be taught by some, it has been proven that markets are over-reactive dynamic systems, and investors are not always rational. One flawed but reasonable way to assess how sentiment around a company has changed is to compare the earnings per share (EPS) with the share price.
Unhappily, NexPoint Real Estate Finance had to report a 74% decline in EPS over the last year. The share price fall of 19% isn't as bad as the reduction in earnings per share. So the market may not be too worried about the EPS figure, at the moment -- or it may have expected earnings to drop faster.
The graphic below depicts how EPS has changed over time (unveil the exact values by clicking on the image).
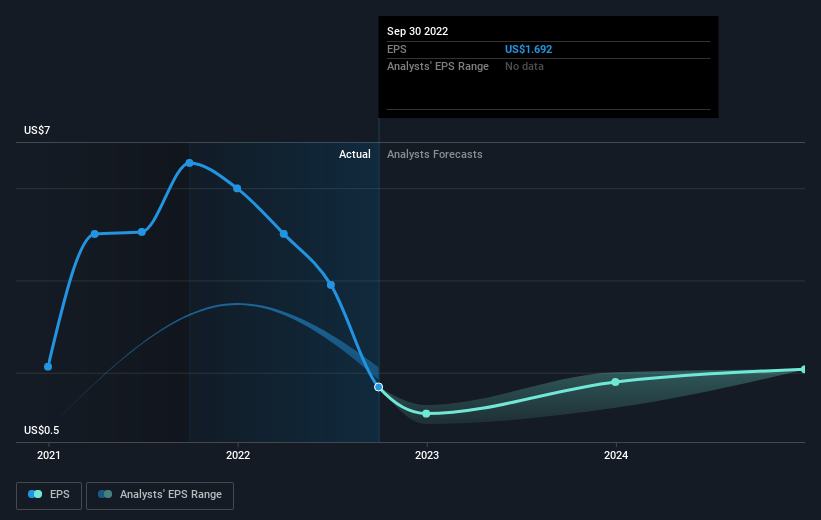
It's good to see that there was some significant insider buying in the last three months. That's a positive. On the other hand, we think the revenue and earnings trends are much more meaningful measures of the business. Dive deeper into the earnings by checking this interactive graph of NexPoint Real Estate Finance's earnings, revenue and cash flow.
What About Dividends?
When looking at investment returns, it is important to consider the difference between total shareholder return (TSR) and share price return. The TSR is a return calculation that accounts for the value of cash dividends (assuming that any dividend received was reinvested) and the calculated value of any discounted capital raisings and spin-offs. It's fair to say that the TSR gives a more complete picture for stocks that pay a dividend. We note that for NexPoint Real Estate Finance the TSR over the last 1 year was -10%, which is better than the share price return mentioned above. And there's no prize for guessing that the dividend payments largely explain the divergence!
A Different Perspective
It's not great that NexPoint Real Estate Finance shares failed to make money for shareholders in the last year, but the silver lining is that the loss of 10%, including dividends, wasn't as bad as the broader market loss of about 24%. On the plus side, the share price has bounced a full 4.7% in the last three months. The recent uptick could be an early suggestion that the prior falls were too extreme; but we'll need to see how the business progresses. While it is well worth considering the different impacts that market conditions can have on the share price, there are other factors that are even more important. To that end, you should learn about the 2 warning signs we've spotted with NexPoint Real Estate Finance (including 1 which doesn't sit too well with us) .
NexPoint Real Estate Finance is not the only stock insiders are buying. So take a peek at this free list of growing companies with insider buying.
Please note, the market returns quoted in this article reflect the market weighted average returns of stocks that currently trade on US exchanges.
Have feedback on this article? Concerned about the content? Get in touch with us directly. Alternatively, email editorial-team (at) simplywallst.com.
This article by Simply Wall St is general in nature. We provide commentary based on historical data and analyst forecasts only using an unbiased methodology and our articles are not intended to be financial advice. It does not constitute a recommendation to buy or sell any stock, and does not take account of your objectives, or your financial situation. We aim to bring you long-term focused analysis driven by fundamental data. Note that our analysis may not factor in the latest price-sensitive company announcements or qualitative material. Simply Wall St has no position in any stocks mentioned.
Join A Paid User Research Session
You’ll receive a US$30 Amazon Gift card for 1 hour of your time while helping us build better investing tools for the individual investors like yourself. Sign up here
