Nexstar Media Group Reports Q4 Revenue Decline Amid Political Ad Dip
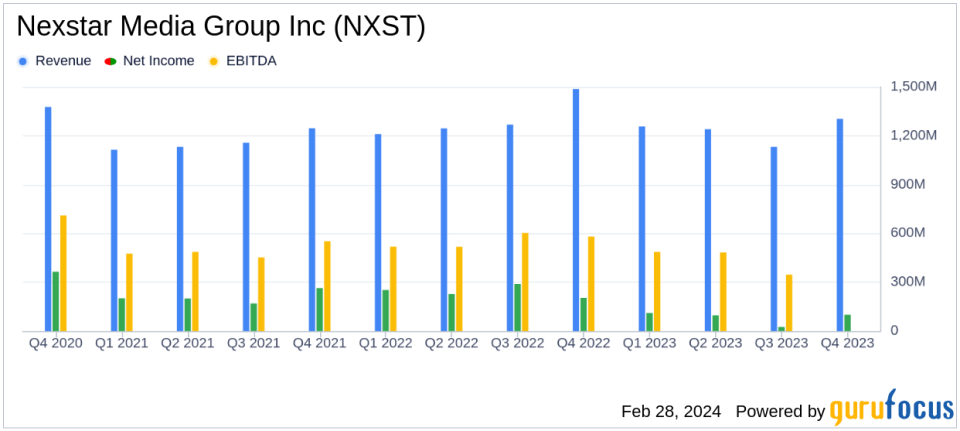
Net Revenue: Q4 net revenue fell 12.3% to $1.3 billion, full-year net revenue decreased 5.3% to $4.93 billion.
Net Income: Q4 net income dropped 43.8% to $100 million, with a full-year plunge of 71.4% to $270 million.
Adjusted EBITDA: Q4 Adjusted EBITDA decreased 31.3% to $411 million, full-year Adjusted EBITDA down 33.9% to $1.469 billion.
Distribution Revenue: Q4 distribution revenue rose 14.3% to $704 million, contributing to a full-year increase of 6.1%.
Free Cash Flow: Attributable Free Cash Flow for Q4 was $265 million, a 37.2% decline, with a full-year drop of 43.6% to $847 million.
Debt Reduction: Nexstar reduced its debt by approximately $32 million in Q4.
Shareholder Returns: Returned $137 million to shareholders in Q4 through buybacks and dividends.
On February 28, 2024, Nexstar Media Group Inc (NASDAQ:NXST) released its 8-K filing, outlining the financial results for the fourth quarter and full year ended December 31, 2023. The company, which is the largest television station owner/operator in the United States, reported a decrease in net revenue and net income, primarily due to a significant drop in political advertising revenue post-election year. Despite this, Nexstar saw an increase in distribution revenue and maintained a strong Adjusted EBITDA margin.
Company Overview
Nexstar Media Group Inc (NASDAQ:NXST) operates 200 stations across 116 markets, reaching over 68% of U.S. TV households. With a strong presence in the broadcasting industry, Nexstar owns NewsNation, 75% of The CW, and a 31% stake in Food Network and Cooking Channel. The company's extensive network includes affiliations with major broadcasters such as CBS, Fox, NBC, and ABC, and it has a significant footprint in top U.S. television markets.
Financial Performance and Challenges
The fourth quarter saw a steep decline in political advertising revenue, which fell by 88.7% to $30 million, reflecting the cyclical nature of election-related spending. This contributed to a 12.3% decrease in overall net revenue to $1.3 billion for the quarter. For the full year, net revenue decreased by 5.3% to $4.93 billion. Net income also saw a sharp decline, falling 43.8% to $100 million in the fourth quarter and 71.4% to $270 million for the full year.
Despite these challenges, Nexstar's distribution revenue grew by 14.3% to $704 million in the fourth quarter, driven by renewed distribution agreements and growth in virtual MVPD revenue. This growth in distribution is critical for Nexstar, as it helps to offset the volatility in advertising revenue and provides a more stable revenue stream.
Financial Achievements and Industry Significance
Nexstar's financial achievements in the fourth quarter, particularly the growth in distribution revenue, underscore the company's strategic focus on diversifying its revenue streams. In the Media - Diversified industry, where content distribution is increasingly important, Nexstar's ability to secure favorable terms in distribution agreements and expand its reach is a significant competitive advantage.
Key Financial Metrics and Commentary
Adjusted EBITDA for the fourth quarter was $411 million, a decrease of 31.3% year-over-year, with a margin of 31.5%. Attributable Free Cash Flow for the quarter was $265 million, down 37.2% from the previous year. Nexstar's Chairman and CEO, Perry A. Sook, commented on the results:
"Nexstars fourth quarter financial results outperformed consensus expectations in key financial metrics including Adjusted EBITDA and Attributable Free Cash Flow. Our 2023 results extend Nexstars long record of consistently generating substantial free cash flow, and we expect that trend to continue."
These metrics are crucial as they reflect the company's operational efficiency and its ability to generate cash for reinvestment and shareholder returns.
Debt and Leverage
As of December 31, 2023, Nexstar's consolidated debt stood at $6.84 billion, with a first lien net leverage ratio of 2.25x and a total net leverage ratio of 3.76x. The company's leverage ratios are calculated in accordance with its credit agreements and are indicative of its financial health and creditworthiness.
Looking Ahead
For the full year of 2024, Nexstar has issued an Adjusted EBITDA guidance range of $2.085 billion to $2.195 billion. This outlook is based on several factors, including political advertising spend, pay television subscriber trends, and the performance of the TV Food Network.
Nexstar's performance in the fourth quarter and full year of 2023 reflects the cyclical nature of the broadcasting industry and the challenges of a non-election year. However, the company's strategic initiatives, including distribution revenue growth and content rights acquisitions, position it well for future growth and continued shareholder returns.
For more detailed financial information and the full earnings report, please refer to Nexstar's 8-K filing.
Explore the complete 8-K earnings release (here) from Nexstar Media Group Inc for further details.
This article first appeared on GuruFocus.
