NIKE (NKE) Q4 Earnings Miss Estimates, Revenues Rise Y/Y
NIKE Inc. NKE reported fourth-quarter fiscal 2023 results, wherein revenues beat the Zacks Consensus Estimate, while earnings missed the same. Results benefited from the company’s business strategy, compelling product innovation and digital leadership. However, high operating costs and expenses affected its margin and profitability.
Following the earnings results, shares of NIKE gained 0.3% in the after-hours trading session on Jun 29.
Shares of the Zacks Rank #3 (Hold) company have lost 5.6% in the past three months compared with the industry’s decline of 4.1%.
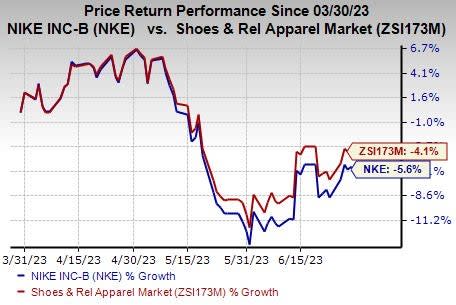
Image Source: Zacks Investment Research
Q4 Highlights
In fourth-quarter fiscal 2023, the company’s earnings per share were 66 cents, down 26.7% from 90 cents reported in the year-ago quarter. The metric missed the Zacks Consensus Estimate of 67 cents.
Revenues of the Swoosh brand owner grew 5% year over year to $12,825 million and surpassed the Zacks Consensus Estimate of $12,595 million. On a currency-neutral basis, revenues advanced 8% year over year, driven by broad-based growth across all brands, channels and geographies.
Sales at NIKE Direct were $5.5 billion, up 15% on a reported basis and 18% on a currency-neutral basis. The 18% currency-neutral increase included 14% growth at NIKE Brand Digital and a 24% rise at NIKE stores.
Wholesale revenues declined 2% on a reported basis but increased 2% on a currency-neutral basis. The results reflect the impact of the company’s supply tightening to normalize marketplace inventory levels.
Operating Segments
The NIKE Brand revenues were $12,225 million, up 5% year over year on a reported basis. Revenues for the brand rose 8% on a currency-neutral basis. Results were driven by double-digit revenue growth in Greater China. Also, revenues in North America, Europe, the Middle East & Africa (“EMEA”) and Asia Pacific & Latin America (“APLA”) witnessed single-digit growth in the quarter.
Within the NIKE brand, revenues in North America advanced 5%, both on a reported basis and a currency-neutral basis to $5,335 million. The upside can be attributed to strong consumer demand that drove retail sales, higher member engagement on digital platforms and strength across its brands. Sales for the NIKE Direct business were up 15% in the region, while digital sales grew 17%, owing to double-digit growth in store traffic.
In EMEA, the company’s revenues rose 3% on a reported basis and 7% on a currency-neutral basis to $3,350 million, driven by strength across performance and lifestyle and strong growth in digital sales. NIKE Direct revenues for the segment grew 28% on a currency-neutral basis, with 24% growth in NIKE Digital. The results were driven by double-digit growth in traffic and an expansion in conversion rates. Strong brick-and-mortar traffic in key countries was also an upside.
In Greater China, revenues increased 16% year over year on a reported basis and advanced 25% on a currency-neutral basis in the fiscal fourth quarter to $1,810 million. The region has been witnessing solid sports brand sales, strong traffic in brick-and-mortar and a clean inventory position. NIKE Direct rose 19% on a currency-neutral basis, while NIKE Digital revenues fell 12% year over year.
In APLA, NIKE’s revenues rose 1% on a reported basis and 6% on a currency-neutral basis to $1,696 million. NIKE Direct advanced 9% on a currency-neutral basis, with a 9% surge in NIKE Digital.
Revenues at the Converse brand fell 1% on a reported basis to $586 million. On a currency-neutral basis, Converse’s revenues were up 1%, backed by double-digit growth in Asia, somewhat offset by sluggishness in Europe.
For fiscal 2023, the company’s earnings came in at $3.23, down 14% year over year. Revenues increased 10% year over year to $51,217 million.
Costs & Margins
The gross profit rose 2% year over year to $5,595 million, while the gross margin contracted by 140 basis points (bps) to 43.6%. The decline in the gross margin can be attributed to increased freight and logistics costs, elevated product input costs, higher markdowns and currency headwinds. This was partly negated by the company’s pricing actions.
Selling and administrative expenses rose 8% to $4,374 million. As a percentage of sales, SG&A expenses expanded 110 bps from the prior-year quarter to 34.1%.
Demand-creation expenses increased 3% year over year to $1,092 million, owing to elevated sports marketing and advertising investments.
Operating overhead expenses were up 10% to $3,282 million on higher wage-related expenses and NIKE Direct variable costs.
Balance Sheet & Shareholder-Friendly Moves
The company ended the quarter with cash and cash equivalents of $7,441 million, down 13% year over year. Short-term investments were $3,234 million, down 27% year over year. It had long-term debt (excluding current maturities) of $8,927 million and shareholders’ equity of $14,004 million as of May 31, 2023.
As of May 31, 2023, inventories of $8,454 million increased by 0.4% from prior-year levels.
In fourth-quarter fiscal 2023, the company returned $1.9 billion to shareholders, including $1.4 billion in share repurchases and $524 million in dividends. With the share repurchases, 11.5 million shares have been retired as part of the $18 billion share repurchase program approved by the company in June 2022.
Outlook
Backed by solid consumer momentum, a robust product innovation pipeline and a strong inventory, management provided solid outlook for fiscal 2024. For the fiscal year, it expects revenues to grow in the mid-single digits, driven by NIKE Direct.
The fiscal 2024 gross margin is envisioned to expand by 140-160 bps on a reported basis. This reflects 50 bps of foreign exchange headwinds. SG&A expenses are predicted to increase due to higher investment in demand creation and product launches. The effective tax rate is forecast to be around 18%.
For the fiscal first quarter, the metric is anticipated to see flat to low-single-digit revenue growth. SG&A expenses are expected to grow in the low double digits, owing to increased demand creation investments.
3 Red-Hot Stocks
Some better-ranked stocks are Bluegreen Vacations Holding Corporation BVH, Alto Ingredients, Inc. ALTO and BrightView Holdings, Inc. BV.
Bluegreen Vacations, a vacation ownership company, currently sports a Zacks Rank #1 (Strong Buy). You can see the complete list of today’s Zacks #1 Rank stocks here.
The Zacks Consensus Estimate for Bluegreen Vacations’ current financial-year sales and earnings per share suggests growth of 3.6% and 17.6%, respectively, from the year-ago reported figures. BVH has a trailing four-quarter earnings surprise of 24.7%, on average.
Alto Ingredients, a manufacturer of specialty alcohols and essential ingredients, currently carries a Zacks Rank #2 (Buy).
The Zacks Consensus Estimate for Alto Ingredients’ current financial-year sales suggests a decline of 6.6% from the year-ago reported figure, whereas earnings per share are expected to rise 78.3%. ALTO had an earnings surprise of 10.5% in the last reported quarter.
BrightView, a provider of commercial landscaping services, primarily in the United States, currently carries a Zacks Rank #2. BV has a trailing four-quarter earnings surprise of 31.4%, on average.
The Zacks Consensus Estimate for BrightView’s current financial-year sales suggests growth of 2.7% from the year-ago period’s reported level, whereas the same for earnings indicates a decline of 35%.
Want the latest recommendations from Zacks Investment Research? Today, you can download 7 Best Stocks for the Next 30 Days. Click to get this free report
NIKE, Inc. (NKE) : Free Stock Analysis Report
BrightView Holdings, Inc. (BV) : Free Stock Analysis Report
Bluegreen Vacations Holding Corporation (BVH) : Free Stock Analysis Report
Alto Ingredients, Inc. (ALTO) : Free Stock Analysis Report
