NMI Holdings (NMIH) Q2 Earnings Top Estimates, Increase Y/Y
NMI Holdings Inc. NMIH reported second-quarter 2023 operating net income per share of 95 cents, which beat the Zacks Consensus Estimate by 9.2%. The bottom line increased 10.4% year over year.
The quarterly results reflected lower operating expenses, higher premiums and net investment income and increasing persistency, which drove growth in the company’s high-quality insured portfolio.
NMI Holdings Inc Price, Consensus and EPS Surprise
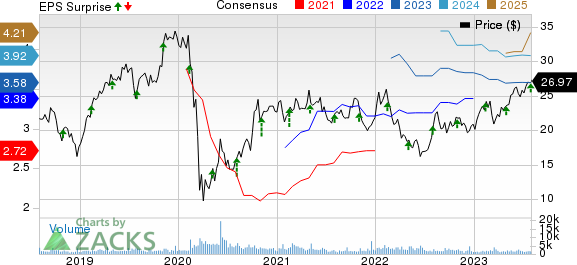
NMI Holdings Inc price-consensus-eps-surprise-chart | NMI Holdings Inc Quote
Operational Update
NMI Holdings’ total operating revenues of $143 million increased 8.3% year over year on higher net premiums earned (up 4.2%) and net investment income (up 51.2%). Revenues beat the Zacks Consensus Estimate by 2.1%.
Primary insurance-in-force increased 13.5% to $191.3 billion. Annual persistency was 86%, up 1000 basis points (bps) year over year.
New insurance written was $11.5 billion, down 30.9% year over year.
Underwriting and operating expenses totaled $27.4 million, down 10.7% year over year. Insurance claims and claim expenses were $2.9 million compared with a benefit of $3 million in the year-ago quarter.
The loss ratio was 2.3 against (2.5) in the year-ago quarter.
The adjusted expense ratio of 21.8 improved 360 bps year over year, while the adjusted combined ratio of 24.1 deteriorated 120 bps year over year.
Financial Update
Book value per share, a measure of net worth, was up 18% year over year to $21.25 as of Jun 30, 2023.
NMI Holdings had $73.3 million in cash and cash equivalents, up 65% from the 2022 end. The debt balance of $396.8 million increased 0.2% from the 2022 end.
Annualized adjusted return on equity was 18.6%, which contracted 80 bps year over year.
Total PMIERs available assets were $2.5 billion and net risk-based required assets totaled $1.3 billion at second-quarter 2023 end.
Zacks Rank
NMI Holdings currently carries a Zacks Rank #3 (Hold). You can see the complete list of today’s Zacks #1 Rank (Strong Buy) stocks here.
Performance of Other Property & Casualty Insurers
Arch Capital Group Ltd. ACGL reported a second-quarter 2023 operating income of $1.92 per share, beating the Zacks Consensus Estimate by 16.4%. The bottom line increased 43.3% year over year. Gross premiums written improved 25.2% year over year to $4.8 billion. Net premiums written climbed 27.7% year over year to $3.4 billion on higher premiums written across its Insurance and Reinsurance segments and beat our estimate of $3.1 billion.
Net investment income increased 128.3% year over year to $242 million and beat our estimate of $115.3 million. The Zacks Consensus Estimate was pegged at $185 million. Operating revenues of $3.2 billion rose 32.6% year over year. It beat the Zacks Consensus Estimate by 2.3%.
Pre-tax current accident year catastrophic losses, net of reinsurance and reinstatement premiums, were $119 million. Arch Capital’s underwriting income increased 13.1% year over year to $606 million. Our estimate was $686.8 million.
Cincinnati Financial Corporation CINF reported a second-quarter 2023 operating income of $1.21 per share, which surpassed the Zacks Consensus Estimate by 68%. The bottom line doubled year over year. Total operating revenues in the quarter under review were $2.1 billion, which improved 9.9% year over year. Also, the top line missed the consensus mark by 0.7%.
Net written premiums climbed 9% year over year to $2.1 billion and matched our estimate. Investment income, net of expenses, increased 13% year over year to $220 million and beat our estimate of $209.6 million. The Zacks Consensus Estimate was pegged at $213 million. Total benefits and expenses of Cincinnati Financial increased 3.5% year over year to $1.9 billion. Our estimate was $2.1 billion.
In its P&C insurance business, Cincinnati Financial witnessed an underwriting income of $47 million against an underwriting loss of $52 million in the year-earlier period. Our estimate was pegged at a loss of $67.4 million. The combined ratio — a measure of underwriting profitability — improved 560 bps year over year to 97.6. Our estimate was 103.7. The Zacks Consensus Estimate was pegged at 101.
Kinsale Capital Group KNSL delivered second-quarter 2023 net operating earnings of $2.88 per share, which outpaced the Zacks Consensus Estimate by 14.7%. The bottom line improved 50% year over year. Total revenues rose about 60.8% year over year to about $295.7 million.
Gross written premiums of $438.2 million rose 58.2% year over year. Our estimate was $343.2 million. Net written premiums climbed 41% year over year to $242.3 million in the quarter. Our estimate for net written premiums was pegged at a loss of $282.2 million. Net investment income more than doubled year over year to $24.2 million in the quarter and beat our estimate of $14.9 million. The Zacks Consensus Estimate was pegged at $20.7 million.
Total expenses increased 35.8% year over year to $205.6 million due to a rise in losses and loss adjustment expenses, underwriting, acquisition and insurance expenses, interest expenses and other expenses. Our estimate was pinned at $197.9 million. Kinsale Capital’s underwriting income of $61.5 million soared 39.3% year over year. Our estimate was $50.8 million. The combined ratio improved 70 bps to 76.7 in the quarter under review. While the expense ratio improved 150 bps to 21 in the quarter, the loss ratio deteriorated 80 bps to 55.7.
Want the latest recommendations from Zacks Investment Research? Today, you can download 7 Best Stocks for the Next 30 Days. Click to get this free report
Cincinnati Financial Corporation (CINF) : Free Stock Analysis Report
Arch Capital Group Ltd. (ACGL) : Free Stock Analysis Report
NMI Holdings Inc (NMIH) : Free Stock Analysis Report
Kinsale Capital Group, Inc. (KNSL) : Free Stock Analysis Report
