NorthWestern (NASDAQ:NWE) sheds US$95m, company earnings and investor returns have been trending downwards for past three years
Many investors define successful investing as beating the market average over the long term. But the risk of stock picking is that you will likely buy under-performing companies. We regret to report that long term NorthWestern Corporation (NASDAQ:NWE) shareholders have had that experience, with the share price dropping 23% in three years, versus a market return of about 36%. The falls have accelerated recently, with the share price down 12% in the last three months. However, one could argue that the price has been influenced by the general market, which is down 9.9% in the same timeframe.
Since NorthWestern has shed US$95m from its value in the past 7 days, let's see if the longer term decline has been driven by the business' economics.
View our latest analysis for NorthWestern
In his essay The Superinvestors of Graham-and-Doddsville Warren Buffett described how share prices do not always rationally reflect the value of a business. One imperfect but simple way to consider how the market perception of a company has shifted is to compare the change in the earnings per share (EPS) with the share price movement.
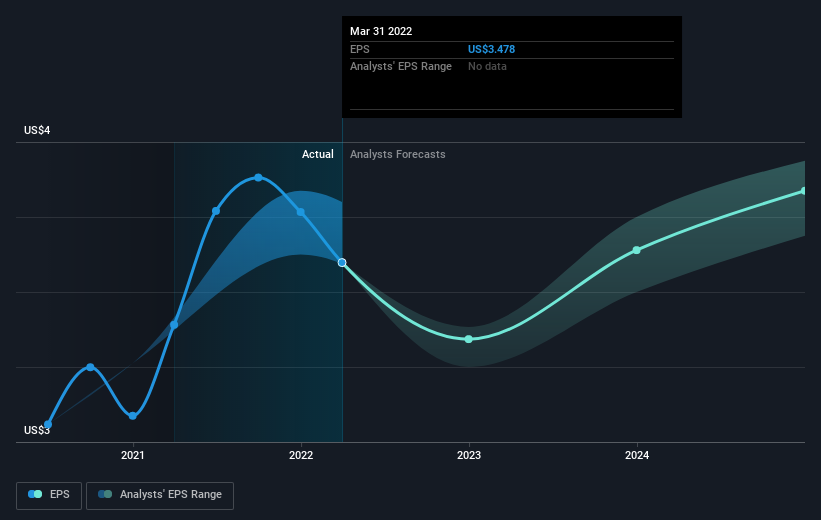
NorthWestern saw its EPS decline at a compound rate of 7.0% per year, over the last three years. This fall in EPS isn't far from the rate of share price decline, which was 8% per year. So it seems like sentiment towards the stock hasn't changed all that much over time. Rather, the share price has approximately tracked EPS growth.
The image below shows how EPS has tracked over time (if you click on the image you can see greater detail).
We're pleased to report that the CEO is remunerated more modestly than most CEOs at similarly capitalized companies. But while CEO remuneration is always worth checking, the really important question is whether the company can grow earnings going forward. Dive deeper into the earnings by checking this interactive graph of NorthWestern's earnings, revenue and cash flow.
What About Dividends?
It is important to consider the total shareholder return, as well as the share price return, for any given stock. The TSR incorporates the value of any spin-offs or discounted capital raisings, along with any dividends, based on the assumption that the dividends are reinvested. It's fair to say that the TSR gives a more complete picture for stocks that pay a dividend. As it happens, NorthWestern's TSR for the last 3 years was -13%, which exceeds the share price return mentioned earlier. And there's no prize for guessing that the dividend payments largely explain the divergence!
A Different Perspective
While it's never nice to take a loss, NorthWestern shareholders can take comfort that , including dividends,their trailing twelve month loss of 7.2% wasn't as bad as the market loss of around 14%. Longer term investors wouldn't be so upset, since they would have made 2%, each year, over five years. In the best case scenario the last year is just a temporary blip on the journey to a brighter future. I find it very interesting to look at share price over the long term as a proxy for business performance. But to truly gain insight, we need to consider other information, too. Case in point: We've spotted 3 warning signs for NorthWestern you should be aware of, and 1 of them shouldn't be ignored.
Of course, you might find a fantastic investment by looking elsewhere. So take a peek at this free list of companies we expect will grow earnings.
Please note, the market returns quoted in this article reflect the market weighted average returns of stocks that currently trade on US exchanges.
Have feedback on this article? Concerned about the content? Get in touch with us directly. Alternatively, email editorial-team (at) simplywallst.com.
This article by Simply Wall St is general in nature. We provide commentary based on historical data and analyst forecasts only using an unbiased methodology and our articles are not intended to be financial advice. It does not constitute a recommendation to buy or sell any stock, and does not take account of your objectives, or your financial situation. We aim to bring you long-term focused analysis driven by fundamental data. Note that our analysis may not factor in the latest price-sensitive company announcements or qualitative material. Simply Wall St has no position in any stocks mentioned.
Join A Paid User Research Session
You’ll receive a US$30 Amazon Gift card for 1 hour of your time while helping us build better investing tools for the individual investors like yourself. Sign up here
