Can Novo Nordisk A/S's (CPH:NOVO B) ROE Continue To Surpass The Industry Average?

While some investors are already well versed in financial metrics (hat tip), this article is for those who would like to learn about Return On Equity (ROE) and why it is important. By way of learning-by-doing, we'll look at ROE to gain a better understanding of Novo Nordisk A/S (CPH:NOVO B).
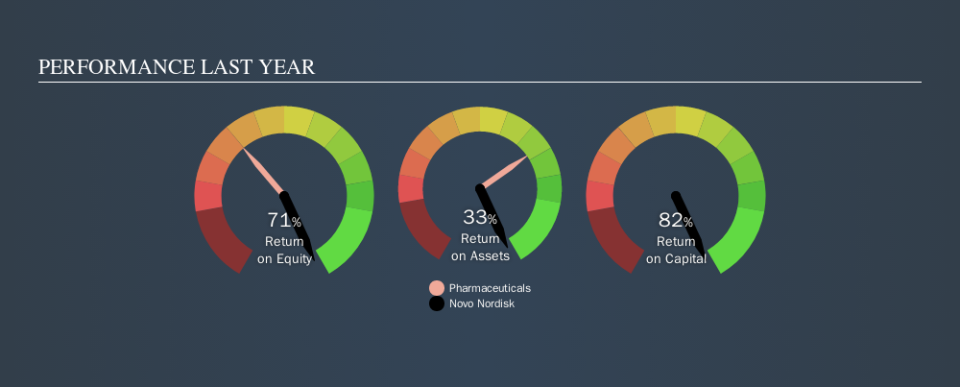
Novo Nordisk has a ROE of 71%, based on the last twelve months. Another way to think of that is that for every DKK1 worth of equity in the company, it was able to earn DKK0.71.
See our latest analysis for Novo Nordisk
How Do I Calculate Return On Equity?
The formula for ROE is:
Return on Equity = Net Profit ÷ Shareholders' Equity
Or for Novo Nordisk:
71% = ø38b ÷ ø53b (Based on the trailing twelve months to June 2019.)
Most know that net profit is the total earnings after all expenses, but the concept of shareholders' equity is a little more complicated. It is the capital paid in by shareholders, plus any retained earnings. You can calculate shareholders' equity by subtracting the company's total liabilities from its total assets.
What Does ROE Signify?
Return on Equity measures a company's profitability against the profit it has kept for the business (plus any capital injections). The 'return' is the yearly profit. That means that the higher the ROE, the more profitable the company is. So, all else equal, investors should like a high ROE. That means it can be interesting to compare the ROE of different companies.
Does Novo Nordisk Have A Good ROE?
One simple way to determine if a company has a good return on equity is to compare it to the average for its industry. Importantly, this is far from a perfect measure, because companies differ significantly within the same industry classification. As is clear from the image below, Novo Nordisk has a better ROE than the average (9.5%) in the Pharmaceuticals industry.
That's what I like to see. In my book, a high ROE almost always warrants a closer look. For example you might check if insiders are buying shares.
Why You Should Consider Debt When Looking At ROE
Companies usually need to invest money to grow their profits. That cash can come from issuing shares, retained earnings, or debt. In the first two cases, the ROE will capture this use of capital to grow. In the latter case, the debt used for growth will improve returns, but won't affect the total equity. That will make the ROE look better than if no debt was used.
Novo Nordisk's Debt And Its 71% ROE
While Novo Nordisk does have a tiny amount of debt, with debt to equity of just 0.08, we think the use of debt is very modest. When I see a high ROE, fuelled by only modest debt, I suspect the business is high quality. Conservative use of debt to boost returns is usually a good move for shareholders, though it does leave the company more exposed to interest rate rises.
The Key Takeaway
Return on equity is useful for comparing the quality of different businesses. A company that can achieve a high return on equity without debt could be considered a high quality business. If two companies have the same ROE, then I would generally prefer the one with less debt.
But ROE is just one piece of a bigger puzzle, since high quality businesses often trade on high multiples of earnings. The rate at which profits are likely to grow, relative to the expectations of profit growth reflected in the current price, must be considered, too. So I think it may be worth checking this free report on analyst forecasts for the company.
Of course, you might find a fantastic investment by looking elsewhere. So take a peek at this free list of interesting companies.
We aim to bring you long-term focused research analysis driven by fundamental data. Note that our analysis may not factor in the latest price-sensitive company announcements or qualitative material.
If you spot an error that warrants correction, please contact the editor at editorial-team@simplywallst.com. This article by Simply Wall St is general in nature. It does not constitute a recommendation to buy or sell any stock, and does not take account of your objectives, or your financial situation. Simply Wall St has no position in the stocks mentioned. Thank you for reading.
