Is NRG Energy (NRG) Too Good to Be True? A Comprehensive Analysis of a Potential Value Trap
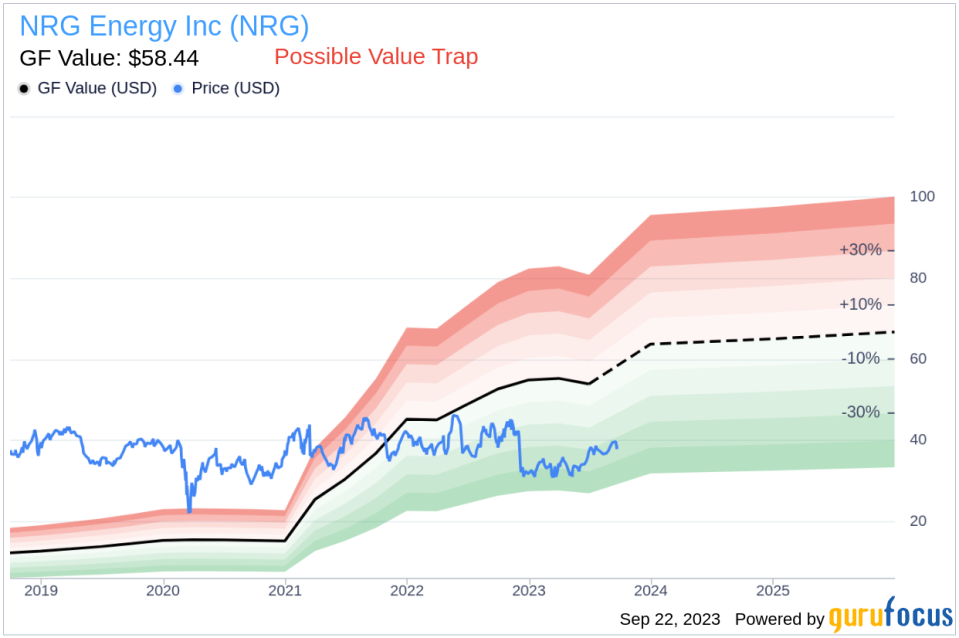
Value-focused investors are always on the hunt for stocks that are priced below their intrinsic value. One such stock that merits attention is NRG Energy Inc (NYSE:NRG). The stock, which is currently priced at 38.63, recorded a gain of 1.95% in a day and a 3-month increase of 11.83%. The stock's fair valuation is $58.44, as indicated by its GF Value.
Understanding the GF Value
The GF Value represents the current intrinsic value of a stock derived from our exclusive method. The GF Value Line on our summary page gives an overview of the fair value that the stock should be traded at. It is calculated based on three factors: historical multiples (PE Ratio, PS Ratio, PB Ratio and Price-to-Free-Cash-Flow) that the stock has traded at, GuruFocus adjustment factor based on the company's past returns and growth, and future estimates of the business performance.
We believe the GF Value Line is the fair value that the stock should be traded at. The stock price will most likely fluctuate around the GF Value Line. If the stock price is significantly above the GF Value Line, it is overvalued and its future return is likely to be poor. On the other hand, if it is significantly below the GF Value Line, its future return will likely be higher.
Decoding the Risks
However, investors need to consider a more in-depth analysis before making an investment decision. Despite its seemingly attractive valuation, certain risk factors associated with NRG Energy should not be ignored. These risks are primarily reflected through its low Piotroski F-score of 1, Altman Z-score of 1.04, and a Beneish M-Score of 59.36 that exceeds -1.78, the threshold for potential earnings manipulation. These indicators suggest that NRG Energy, despite its apparent undervaluation, might be a potential value trap. This complexity underlines the importance of thorough due diligence in investment decision-making.
Understanding Key Financial Indicators
The Piotroski F-score, created by accounting professor Joseph Piotroski, is a tool used to assess the strength of a company's financial health. The score is based on nine criteria that fall into three categories: profitability, leverage/liquidity/ source of funds, and operating efficiency. The overall score ranges from 0 to 9, with higher scores indicating healthier financials. NRG Energy's current Piotroski F-Score, however, falls in the lower end of this spectrum, indicating potential red flags for investors.
Before delving into the details, let's understand what the Altman Z-score entails. Invented by New York University Professor Edward I. Altman in 1968, the Z-Score is a financial model that predicts the probability of a company entering bankruptcy within a two-year time frame. The Altman Z-Score combines five different financial ratios, each weighted to create a final score. A score below 1.8 suggests a high likelihood of financial distress, while a score above 3 indicates a low risk.
Developed by Professor Messod Beneish, the Beneish M-Score is based on eight financial variables that reflect different aspects of a company's financial performance and position. These are Days Sales Outstanding (DSO), Gross Margin (GM), Total Long-term Assets Less Property, Plant and Equipment over Total Assets (TATA), change in Revenue (?REV), change in Depreciation and Amortization (?DA), change in Selling, General and Admin expenses (?SGA), change in Debt-to-Asset Ratio (?LVG), and Net Income Less Non-Operating Income and Cash Flow from Operations over Total Assets (?NOATA).
Company Snapshot
NRG Energy is one of the largest retail energy providers in the U.S., with 5.5 million customers. Its 2023 acquisition of Vivint Smart Home adds 1.9 million home services customers. NRG also is one of the largest U.S. independent power producers, with 13 gigawatts of coal, gas, and oil power generation capacity primarily in Texas. NRG exited Chapter 11 bankruptcy as a stand-alone entity in December 2003.
Analysis of NRG Energy's Profitability
Firstly, let's address profitability. One significant component of the F-Score is a positive return on assets (ROA). A closer look at NRG Energy's ROA reveals a worrying trend of negative returns. This indicates the company's inability to generate profit from its assets - a fundamental concern for any investor.
Let's delve deeper into NRG Energy's financial health by examining the decline in its return on assets (ROA) over the past three years. The data indicates 2021: 6.67; 2022: 12.59; 2023: -6.65, when expressed in percentages. Such a decrease is concerning, as the Piotroski F-Score penalizes companies with lower current ROA compared to the previous period. This ongoing decline highlights another potential risk associated with investing in NRG Energy.
Observing the financials of NRG Energy, it's important to note that the cash flow from operations over the trailing twelve months (TTM) stands at $-3857 million, whereas the net income in the same period is significantly higher at $-2055 million. The Piotroski F-score considers this discrepancy as a potential red flag. The rationale behind this is that a company's operating cash flow is a more direct and less manipulated measure of its cash-generating ability than net income. Net income, while important, is susceptible to accounting treatments and non-cash items which can distort the true cash profitability of the company. If a company consistently shows lower cash flows from operations relative to its net income, it could indicate that the earnings quality is poor and the company might have difficulties sustaining its operations or financing its obligations, a fact which could negatively impact its financial stability and investor confidence.
Leverage, Liquidity and Source of Funds: A Worrying Trend
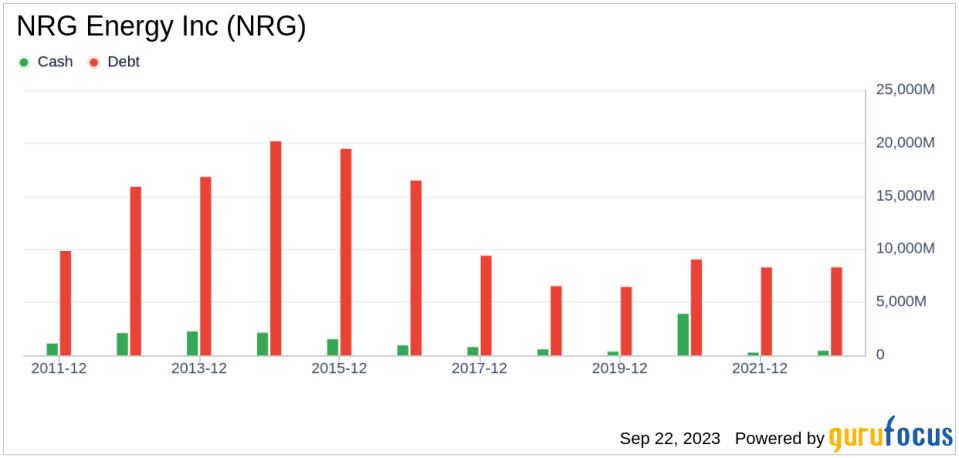
Examining NRG Energy's financial stability, there's a notable decrease in its current ratio over the past three years, as shown by the data 2021: 1.24; 2022: 1.29; 2023: 1.02, which is expressed as percentages. The current ratio is a key indicator of a company's short-term financial health, as it gauges the ability to cover short-term liabilities with short-term assets. A declining current ratio suggests that NRG Energy's liquidity and capability to manage immediate financial obligations are deteriorating.
Operating Efficiency: A Darker Picture
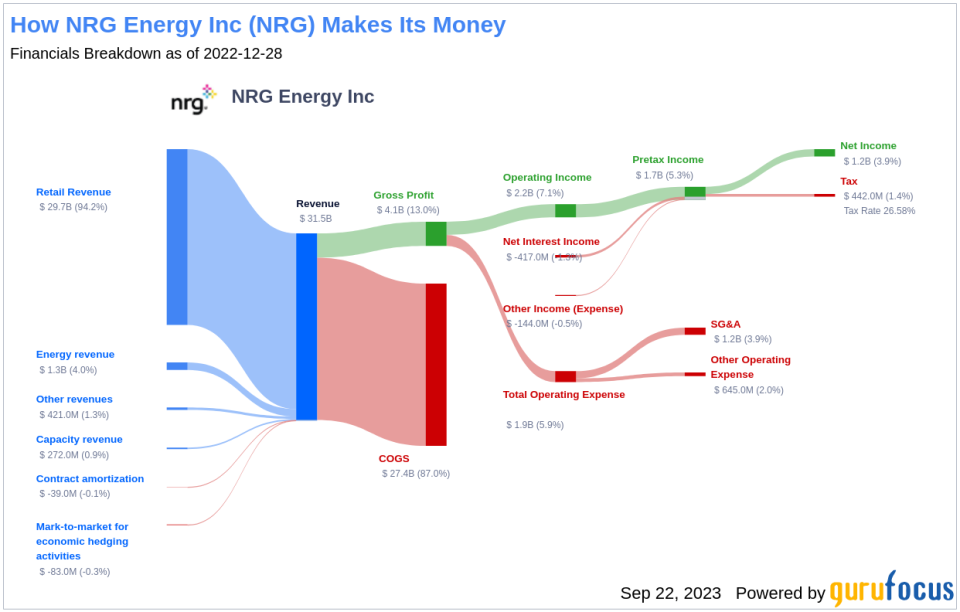
Lastly, concerning operating efficiency, the Piotroski F-score examines changes in gross margin and asset turnover. Regrettably, NRG Energy follows a discouraging trajectory with a decrease in gross margin percentage over the past three years, as demonstrated by the data provided: 2021: 25.95; 2022: 25.45; 2023: 0.22 (expressed in percentages). This contraction in gross margin suggests that NRG Energy is grappling with either an escalation in the cost of goods sold or dwindling prices - both of which are inauspicious indicators for profitability.
While the Piotroski F-score is not the only lens through which to view a potential investment, it is a robust and comprehensive tool for evaluating a company's financial health. Unfortunately for NRG Energy, its current score suggests potential troubles.
NRG Energy's Low Altman Z-Score: A Breakdown of Key Drivers
A dissection of NRG Energy's Altman Z-score reveals NRG Energy's financial health may be weak, suggesting possible financial distress:
When it comes to operational efficiency, a vital indicator for NRG Energy is its asset turnover. The data: 2021: 1.13; 2022: 1.06; 2023: 0.99 from the past three years suggests a recent decline following an initial increase in this ratio. The asset turnover ratio reflects how effectively a company is using its assets to generate sales. Therefore, a drop in this ratio can signify reduced operational efficiency, potentially due to underutilization of assets or decreased market demand for the company's products or services. This shift in NRG Energy's asset turnover underlines the need for the company to reassess its operational strategies to optimize asset usage and boost sales.
The days sales outstanding (DSO) is an important financial metric that denotes the average time a company takes to collect payment after a sale is completed. Looking at the historical data from the past three years (2021: 1.13; 2022: 1.06; 2023: 0.99), there appears to be a rising trend in NRG Energy's DSO.
An uptick in DSO might indicate aggressive revenue recognition practices, and in some cases, potential earnings manipulation. To explain, when DSO increases, it means the company's receivables are growing. This could be a result of sales being recorded before customers have paid, which inflates the revenue figures. In extreme cases, a company may even recognize revenue from sales that may never be collected, an action that is considered earnings manipulation. A rising DSO figure warrants scrutiny as it can signal financial distress or questionable accounting practices within the company. Therefore, investors should closely monitor such trends for early detection of any potential financial risks.
The Gross Margin index tracks the evolution of a company's gross profit as a proportion of its revenue. A downward trend could indicate issues such as overproduction or more generous credit terms, both of which are potential red flags for earnings manipulation. By examining the past three years of NRG Energy's historical data (2021: 25.95; 2022: 25.45; 2023: 0.22), we find that its Gross Margin has contracted by 28.89%. Such a contraction in the gross margin can negatively impact the company
This article first appeared on GuruFocus.
