Nu Skin Enterprises (NYSE:NUS) earnings and shareholder returns have been trending downwards for the last five years, but the stock rises 4.7% this past week
Statistically speaking, long term investing is a profitable endeavour. But along the way some stocks are going to perform badly. For example the Nu Skin Enterprises, Inc. (NYSE:NUS) share price dropped 58% over five years. That is extremely sub-optimal, to say the least. Shareholders have had an even rougher run lately, with the share price down 10% in the last 90 days.
While the last five years has been tough for Nu Skin Enterprises shareholders, this past week has shown signs of promise. So let's look at the longer term fundamentals and see if they've been the driver of the negative returns.
View our latest analysis for Nu Skin Enterprises
There is no denying that markets are sometimes efficient, but prices do not always reflect underlying business performance. By comparing earnings per share (EPS) and share price changes over time, we can get a feel for how investor attitudes to a company have morphed over time.
During the five years over which the share price declined, Nu Skin Enterprises' earnings per share (EPS) dropped by 9.7% each year. This reduction in EPS is less than the 16% annual reduction in the share price. This implies that the market was previously too optimistic about the stock.
You can see below how EPS has changed over time (discover the exact values by clicking on the image).
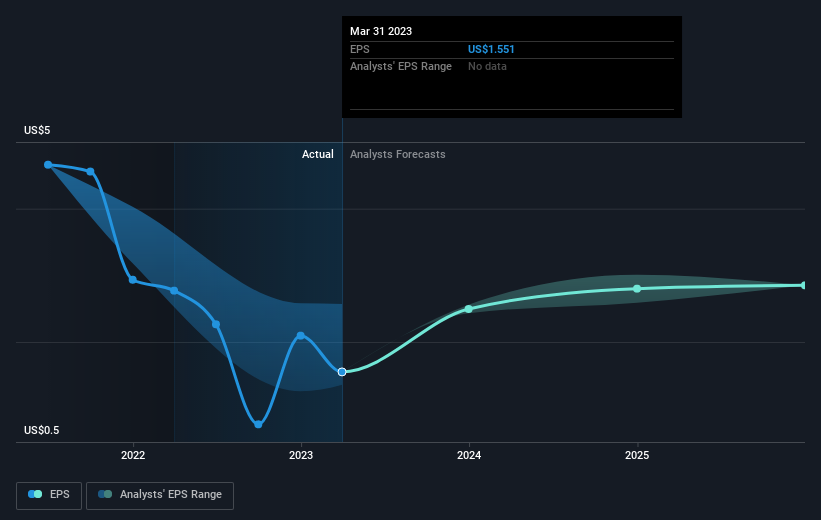
This free interactive report on Nu Skin Enterprises' earnings, revenue and cash flow is a great place to start, if you want to investigate the stock further.
What About Dividends?
When looking at investment returns, it is important to consider the difference between total shareholder return (TSR) and share price return. The TSR incorporates the value of any spin-offs or discounted capital raisings, along with any dividends, based on the assumption that the dividends are reinvested. It's fair to say that the TSR gives a more complete picture for stocks that pay a dividend. In the case of Nu Skin Enterprises, it has a TSR of -50% for the last 5 years. That exceeds its share price return that we previously mentioned. This is largely a result of its dividend payments!
A Different Perspective
Investors in Nu Skin Enterprises had a tough year, with a total loss of 20% (including dividends), against a market gain of about 6.9%. Even the share prices of good stocks drop sometimes, but we want to see improvements in the fundamental metrics of a business, before getting too interested. Unfortunately, last year's performance may indicate unresolved challenges, given that it was worse than the annualised loss of 8% over the last half decade. Generally speaking long term share price weakness can be a bad sign, though contrarian investors might want to research the stock in hope of a turnaround. I find it very interesting to look at share price over the long term as a proxy for business performance. But to truly gain insight, we need to consider other information, too. Even so, be aware that Nu Skin Enterprises is showing 3 warning signs in our investment analysis , and 1 of those doesn't sit too well with us...
If you like to buy stocks alongside management, then you might just love this free list of companies. (Hint: insiders have been buying them).
Please note, the market returns quoted in this article reflect the market weighted average returns of stocks that currently trade on American exchanges.
Have feedback on this article? Concerned about the content? Get in touch with us directly. Alternatively, email editorial-team (at) simplywallst.com.
This article by Simply Wall St is general in nature. We provide commentary based on historical data and analyst forecasts only using an unbiased methodology and our articles are not intended to be financial advice. It does not constitute a recommendation to buy or sell any stock, and does not take account of your objectives, or your financial situation. We aim to bring you long-term focused analysis driven by fundamental data. Note that our analysis may not factor in the latest price-sensitive company announcements or qualitative material. Simply Wall St has no position in any stocks mentioned.
Join A Paid User Research Session
You’ll receive a US$30 Amazon Gift card for 1 hour of your time while helping us build better investing tools for the individual investors like yourself. Sign up here
