Is NVIDIA Corporation's (NASDAQ:NVDA) Recent Stock Performance Tethered To Its Strong Fundamentals?
NVIDIA (NASDAQ:NVDA) has had a great run on the share market with its stock up by a significant 57% over the last three months. Given the company's impressive performance, we decided to study its financial indicators more closely as a company's financial health over the long-term usually dictates market outcomes. In this article, we decided to focus on NVIDIA's ROE.
Return on equity or ROE is an important factor to be considered by a shareholder because it tells them how effectively their capital is being reinvested. In simpler terms, it measures the profitability of a company in relation to shareholder's equity.
See our latest analysis for NVIDIA
How Do You Calculate Return On Equity?
ROE can be calculated by using the formula:
Return on Equity = Net Profit (from continuing operations) ÷ Shareholders' Equity
So, based on the above formula, the ROE for NVIDIA is:
20% = US$4.4b ÷ US$22b (Based on the trailing twelve months to January 2023).
The 'return' is the profit over the last twelve months. One way to conceptualize this is that for each $1 of shareholders' capital it has, the company made $0.20 in profit.
What Has ROE Got To Do With Earnings Growth?
So far, we've learned that ROE is a measure of a company's profitability. Depending on how much of these profits the company reinvests or "retains", and how effectively it does so, we are then able to assess a company’s earnings growth potential. Assuming all else is equal, companies that have both a higher return on equity and higher profit retention are usually the ones that have a higher growth rate when compared to companies that don't have the same features.
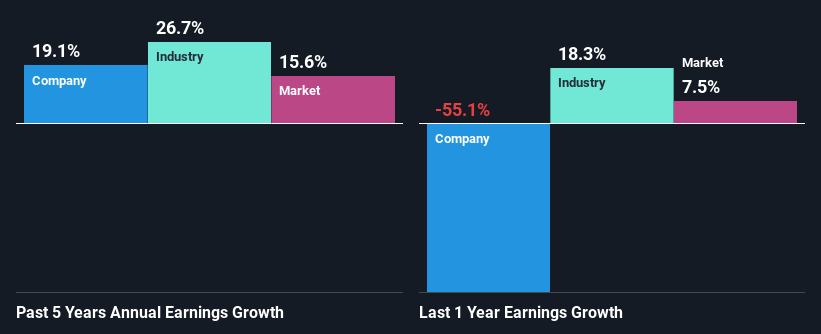
A Side By Side comparison of NVIDIA's Earnings Growth And 20% ROE
To begin with, NVIDIA seems to have a respectable ROE. Further, the company's ROE is similar to the industry average of 18%. This certainly adds some context to NVIDIA's moderate 19% net income growth seen over the past five years.
Next, on comparing with the industry net income growth, we found that NVIDIA's reported growth was lower than the industry growth of 27% in the same period, which is not something we like to see.
The basis for attaching value to a company is, to a great extent, tied to its earnings growth. The investor should try to establish if the expected growth or decline in earnings, whichever the case may be, is priced in. By doing so, they will have an idea if the stock is headed into clear blue waters or if swampy waters await. Is NVIDIA fairly valued compared to other companies? These 3 valuation measures might help you decide.
Is NVIDIA Making Efficient Use Of Its Profits?
NVIDIA has a low three-year median payout ratio of 7.1%, meaning that the company retains the remaining 93% of its profits. This suggests that the management is reinvesting most of the profits to grow the business.
Additionally, NVIDIA has paid dividends over a period of at least ten years which means that the company is pretty serious about sharing its profits with shareholders. Our latest analyst data shows that the future payout ratio of the company is expected to drop to 2.4% over the next three years. The fact that the company's ROE is expected to rise to 48% over the same period is explained by the drop in the payout ratio.
Conclusion
In total, we are pretty happy with NVIDIA's performance. Specifically, we like that the company is reinvesting a huge chunk of its profits at a high rate of return. This of course has caused the company to see a good amount of growth in its earnings. Having said that, looking at the current analyst estimates, we found that the company's earnings are expected to gain momentum. To know more about the latest analysts predictions for the company, check out this visualization of analyst forecasts for the company.
Have feedback on this article? Concerned about the content? Get in touch with us directly. Alternatively, email editorial-team (at) simplywallst.com.
This article by Simply Wall St is general in nature. We provide commentary based on historical data and analyst forecasts only using an unbiased methodology and our articles are not intended to be financial advice. It does not constitute a recommendation to buy or sell any stock, and does not take account of your objectives, or your financial situation. We aim to bring you long-term focused analysis driven by fundamental data. Note that our analysis may not factor in the latest price-sensitive company announcements or qualitative material. Simply Wall St has no position in any stocks mentioned.
Join A Paid User Research Session
You’ll receive a US$30 Amazon Gift card for 1 hour of your time while helping us build better investing tools for the individual investors like yourself. Sign up here
