NZD/USD Technical Analysis: 4-Month Resistance Line in Play
NZD/USD Technical Analysis – Prices are pulling back from resistance at a falling trend line set from early April to probe underneath the 76.4% Fibonacci retracement at 0.8007. A break beneath that targets the 61.8% level at 0.7946. Alternatively, a move above the trend line (now at 0.8015) targets the July 25 high at 0.8106.
Confirm your chart-based trade setups with the Technical Analyzer.
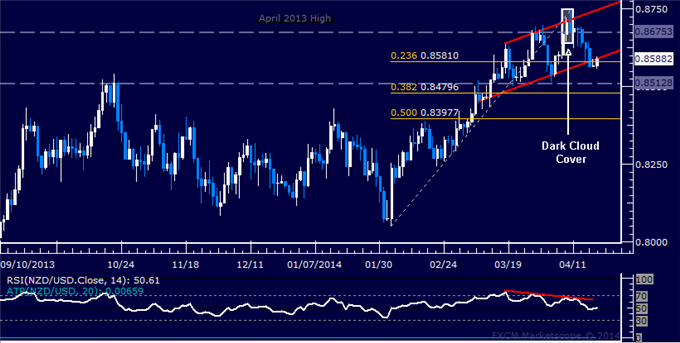
Daily Chart - Created Using FXCM Marketscope 2.0
--- Written by Ilya Spivak, Currency Strategist for Dailyfx.com
To contact Ilya, e-mail ispivak@dailyfx.com. Follow Ilya on Twitter at @IlyaSpivak
To be added to Ilya's e-mail distribution list, please CLICK HERE
New to FX? Watch this Video. For live market updates, visit the Real Time News Feed
DailyFX provides forex news and technical analysis on the trends that influence the global currency markets.
Learn forex trading with a free practice account and trading charts from FXCM.
