Is OceanaGold Corporation’s (TSE:OGC) 3.9% ROCE Any Good?

Today we'll look at OceanaGold Corporation (TSE:OGC) and reflect on its potential as an investment. Specifically, we're going to calculate its Return On Capital Employed (ROCE), in the hopes of getting some insight into the business.
First up, we'll look at what ROCE is and how we calculate it. Then we'll compare its ROCE to similar companies. Last but not least, we'll look at what impact its current liabilities have on its ROCE.
Understanding Return On Capital Employed (ROCE)
ROCE is a measure of a company's yearly pre-tax profit (its return), relative to the capital employed in the business. Generally speaking a higher ROCE is better. Overall, it is a valuable metric that has its flaws. Author Edwin Whiting says to be careful when comparing the ROCE of different businesses, since 'No two businesses are exactly alike.
How Do You Calculate Return On Capital Employed?
Analysts use this formula to calculate return on capital employed:
Return on Capital Employed = Earnings Before Interest and Tax (EBIT) ÷ (Total Assets - Current Liabilities)
Or for OceanaGold:
0.039 = US$71m ÷ (US$2.0b - US$199m) (Based on the trailing twelve months to September 2019.)
So, OceanaGold has an ROCE of 3.9%.
See our latest analysis for OceanaGold
Is OceanaGold's ROCE Good?
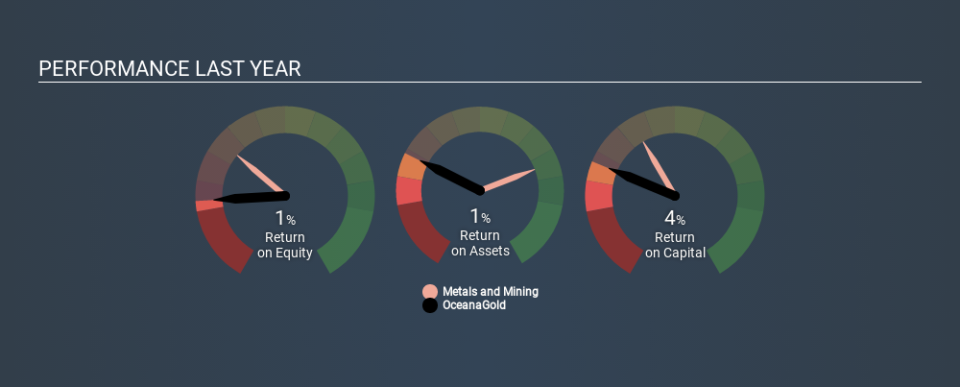
ROCE can be useful when making comparisons, such as between similar companies. Using our data, we find that OceanaGold's ROCE is meaningfully better than the 3.0% average in the Metals and Mining industry. I think that's good to see, since it implies the company is better than other companies at making the most of its capital. Independently of how OceanaGold compares to its industry, its ROCE in absolute terms is low; especially compared to the ~1.4% available in government bonds. It is likely that there are more attractive prospects out there.
We can see that, OceanaGold currently has an ROCE of 3.9%, less than the 8.4% it reported 3 years ago. Therefore we wonder if the company is facing new headwinds. You can click on the image below to see (in greater detail) how OceanaGold's past growth compares to other companies.
When considering ROCE, bear in mind that it reflects the past and does not necessarily predict the future. Companies in cyclical industries can be difficult to understand using ROCE, as returns typically look high during boom times, and low during busts. ROCE is only a point-in-time measure. Remember that most companies like OceanaGold are cyclical businesses. What happens in the future is pretty important for investors, so we have prepared a free report on analyst forecasts for OceanaGold.
OceanaGold's Current Liabilities And Their Impact On Its ROCE
Current liabilities are short term bills and invoices that need to be paid in 12 months or less. Due to the way the ROCE equation works, having large bills due in the near term can make it look as though a company has less capital employed, and thus a higher ROCE than usual. To check the impact of this, we calculate if a company has high current liabilities relative to its total assets.
OceanaGold has total assets of US$2.0b and current liabilities of US$199m. Therefore its current liabilities are equivalent to approximately 9.9% of its total assets. With barely any current liabilities, there is minimal impact on OceanaGold's admittedly low ROCE.
The Bottom Line On OceanaGold's ROCE
Still, investors could probably find more attractive prospects with better performance out there. Of course, you might also be able to find a better stock than OceanaGold. So you may wish to see this free collection of other companies that have grown earnings strongly.
If you like to buy stocks alongside management, then you might just love this free list of companies. (Hint: insiders have been buying them).
If you spot an error that warrants correction, please contact the editor at editorial-team@simplywallst.com. This article by Simply Wall St is general in nature. It does not constitute a recommendation to buy or sell any stock, and does not take account of your objectives, or your financial situation. Simply Wall St has no position in the stocks mentioned.
We aim to bring you long-term focused research analysis driven by fundamental data. Note that our analysis may not factor in the latest price-sensitive company announcements or qualitative material. Thank you for reading.
