Oceaneering International (OII): A Look into its Significant Overvaluation
Oceaneering International Inc (NYSE:OII) has seen a daily gain of 2.68%, and a 3-month gain of 40.69%. Despite a promising Earnings Per Share (EPS) (EPS) of 0.64, the question arises: is the stock significantly overvalued? This article aims to provide an in-depth analysis of Oceaneering International's valuation, encouraging readers to delve into the financial intricacies that determine a stock's true worth.
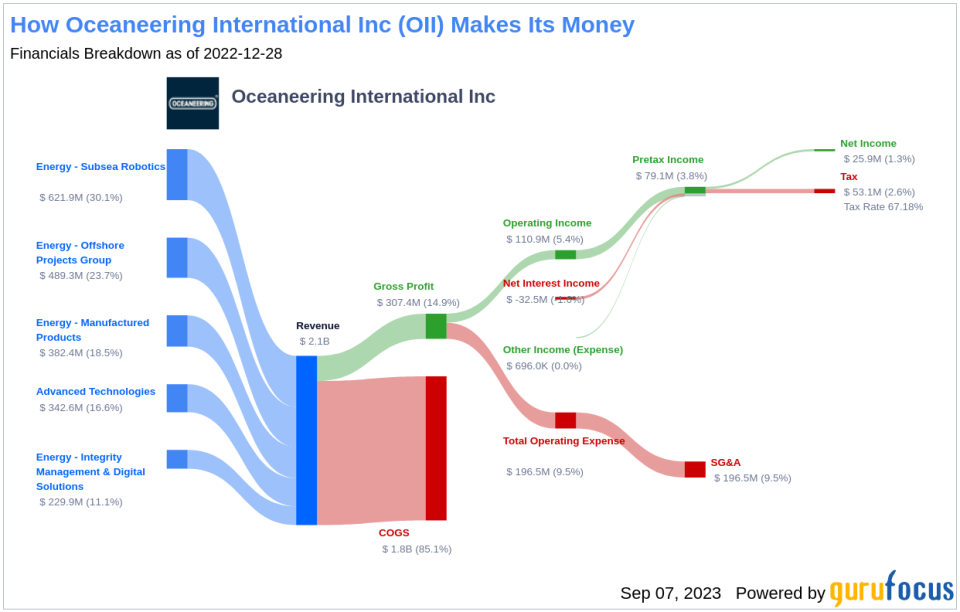
Company Introduction
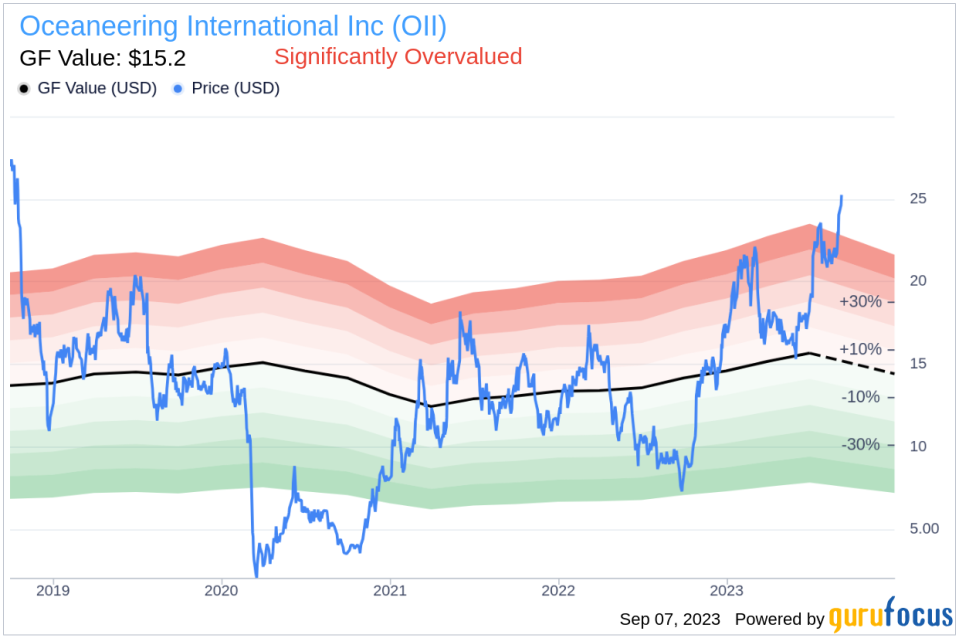
Oceaneering International Inc is a global provider of engineered services and products, offering robotic solutions to the offshore energy, defense, aerospace, manufacturing, and entertainment industries. The majority of Oceaneering's products are produced for the offshore oil and gas market. The company's current stock price is $25.29, with a market cap of $2.50 billion. When compared with its GF Value of $15.2, a proprietary measure of a stock's intrinsic value, it appears that Oceaneering International's stock is significantly overvalued.
GF Value: A Comprehensive Analysis
The GF Value represents the current intrinsic value of a stock. It is calculated based on historical multiples, a GuruFocus adjustment factor based on the company's past returns and growth, and future estimates of business performance. If the stock price is significantly above the GF Value Line, it is overvalued and its future return is likely to be poor. Conversely, if it is significantly below the GF Value Line, its future return will likely be higher.
According to GuruFocus' valuation method, the stock of Oceaneering International is significantly overvalued. This suggests that the long-term return of its stock is likely to be much lower than its future business growth.
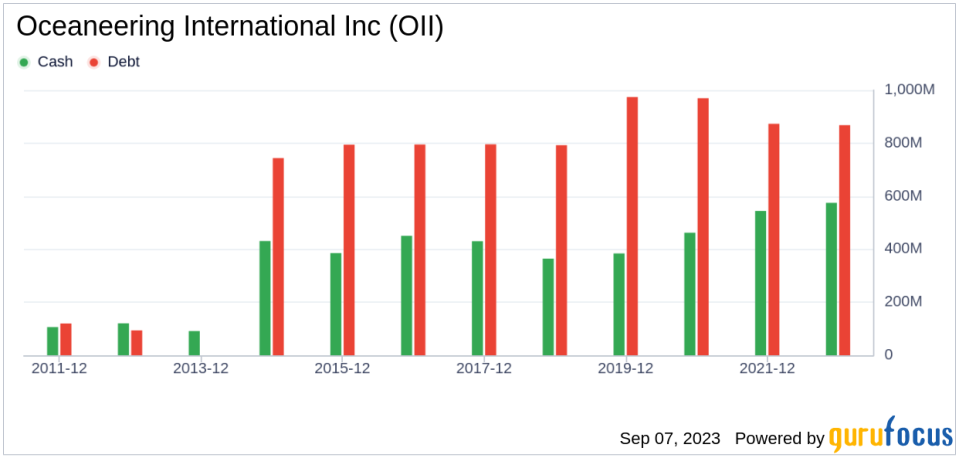
Financial Strength
Investing in companies with low financial strength could result in permanent capital loss. Oceaneering International has a cash-to-debt ratio of 0.53, which ranks better than 50.15% of 1021 companies in the Oil & Gas industry. GuruFocus ranks Oceaneering International's financial strength as 6 out of 10, suggesting a fair balance sheet.
Profitability and Growth
Profitable companies, especially those with consistent profitability over the long term, are generally less risky to invest in. Oceaneering International has been profitable 6 over the past 10 years. However, its operating margin of 7.4% ranks worse than 52.95% of 967 companies in the Oil & Gas industry. This indicates poor profitability.
Growth is a crucial factor in the valuation of a company. Oceaneering International's 3-year average revenue growth rate is worse than 70.71% of 850 companies in the Oil & Gas industry. Its 3-year average EBITDA growth rate is 0%, which ranks worse than 0% of 821 companies in the Oil & Gas industry.
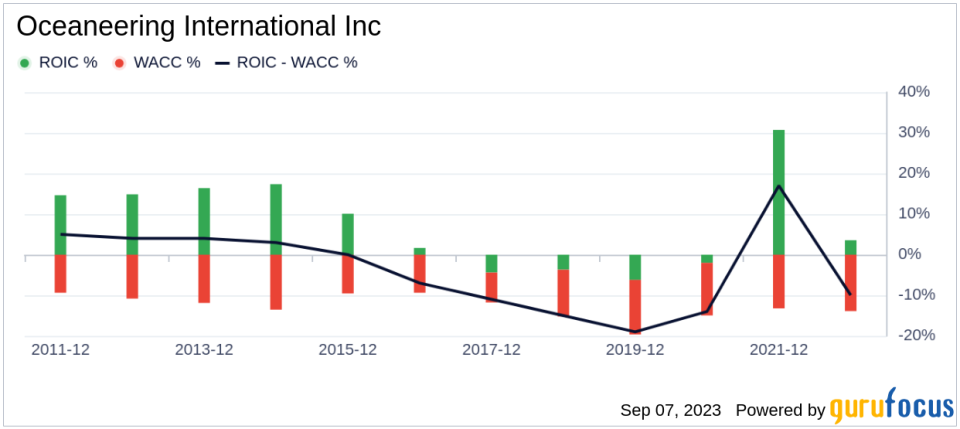
ROIC vs WACC
Another measure of a company's profitability is the comparison of its return on invested capital (ROIC) and the weighted average cost of capital (WACC). For the past 12 months, Oceaneering International's ROIC is 7.21, and its WACC is 13.34.
Conclusion
In conclusion, the stock of Oceaneering International is significantly overvalued. The company's financial condition is fair, but its profitability is poor, and its growth ranks worse than 0% of 821 companies in the Oil & Gas industry. To learn more about Oceaneering International's stock, you can check out its 30-Year Financials here.
To find out the high-quality companies that may deliver above-average returns, please check out the GuruFocus High Quality Low Capex Screener.
This article first appeared on GuruFocus.
