Oceaneering (OII) Q2 Earnings and Revenues Miss Estimates
Oceaneering International OII reported second-quarter 2023 adjusted profit of 18 cents per share, which missed the Zacks Consensus Estimate of 30 cents. This underperformance was due to lower-than-expected operating income from the Subsea Robotics and Manufactured Products segments.
However, the bottom line was better than the year-ago quarter’s figure of 7 cents. This can be attributed to higher-than-expected operating income from the Offshore Projects Group segment.
Total revenues were $597.9 million, which missed the Zacks Consensus Estimate of $602 million. The top line, however, increased approximately 14.1% from the year-ago quarter’s level of $524 million.
Oceaneering International, Inc. Price, Consensus and EPS Surprise
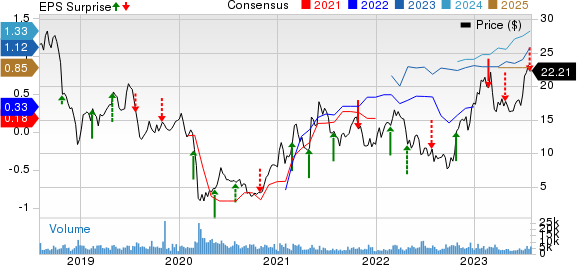
Oceaneering International, Inc. price-consensus-eps-surprise-chart | Oceaneering International, Inc. Quote
Segmental Information
Subsea Robotics: The unit provides remotely operated submersible vehicles for drill support, vessel-based inspection, subsea hardware installation, pipeline surveys and maintenance services.
Revenues totaled $186.5 million compared with $157.1 million in the prior-year period. The figure was also higher than our projection of $179 million. Operating income totaled $42.2 million, higher than the year-ago quarter’s $25.9 million. The figure, however, missed our estimate of $51 million. Days on hire increased 9.6% year over year to 16,032, while Remotely Operated Vehicles’ utilization remained unchanged at 70%.
Manufactured Products: The segment focuses on the manufactured products business, theme park entertainment systems and automated guided vehicles.
Revenues amounted to $124.9 million compared with $105.5 million a year ago. The figure outpaced our projection of $119.2 million. Operating profit totaled $10.6 million against the year-ago quarter’s reported loss of $1.4 million. The figure missed our estimate of $11 million. Backlog rose to $418 million from $335 million as of Jun 30, 2023.
Offshore Projects Group: This segment includes Oceaneering’s former Subsea Projects segment, excluding survey services and global data solutions, and the service and rental business, without ROV tooling.
Revenues increased about 12% to $ 130.5 million from $116.5 million in the year-ago quarter. The figure beat our projection of $125 million. Operating income totaled $17.1 million compared with $17.5 million in the second quarter of 2022. The figure outpaced our estimate of $11.7 million.
Integrity Management & Digital Solutions: This segment mainly covers Oceaneering’s Asset Integrity segment, along with its global data solutions business.
Revenues totaled $63.2 million compared with the year-ago quarter’s figure of $59.4 million. The figure outpaced our projection of $62.3 million. The segment also reported an operating income of $3.8 million compared with $3.4 million a year ago. The figure is higher than our estimate of $3.3 million.
Aerospace and Defense Technologies: The segment is engaged in Oceaneering’s government business and focuses on defense subsea technologies, marine services and space systems.
Revenues totaled $92.8 million compared with $85.6 million in the year-ago quarter. The figure is lower than our projection of $125.2 million. Operating income of $49.2 million increased from $22.8 million in the prior-year quarter. The figure beat our estimate of $11.7 million.
Capital Expenditure & Balance Sheet
Capital expenditure, including acquisitions, totaled $22.4 million. The figure is lower than our projection of $27.2 million. As of Jun 30, 2023, OII had cash and cash equivalents worth $504 million and long-term debt of about $700.4 million. The total debt-to-total capital was 55.9%.
Outlook
For 2023, Oceaneering projects consolidated EBITDA in the $2275-$310 million range and continued free cash flow generation in the band of $90-$130 million. It also anticipates capital expenditures and net income in the range of $90-$110 million and $75-$90 million, respectively.
OII expects a sequential increase in the third quarter, with adjusted EBITDA between $75 million and $85 million due to a high-single-digit percentage rise in revenues.
The company expects increased revenues and operating results in the Subsea Robotics and Offshore Projects Group segments due to robust offshore activity.
While revenues from Integrity Management & Digital Solutions are anticipated to increase a mid-teens percentage point, the operating income margin for manufactured products is anticipated in the mid-single digit range.
For the Aerospace and Defence Technologies segment, OII anticipates improved operating income and operating income margin on a modest increase in revenues, with unallocated expenses in the mid-$40 million range due to higher accruals for performance-based incentive compensation.
Zacks Rank and Other Key Picks
Currently, OII sports a Zack Rank #1 (Strong Buy).
Some other top-ranked stocks for investors interested in the energy sector are Evolution Petroleum EPM, sporting a Zacks Rank #1, and Murphy USA MUSA and NGL Energy Partners NGL, both carrying a Zacks Rank #2 (Buy) at present. You can see the complete list of today’s Zacks #1 Rank stocks here.
Evolution Petroleum is worth approximately $273.80 million. EPM currently pays a dividend of 48 cents per share, or 5.38% on an annual basis.
The company currently has a forward P/E ratio of 7.62. In comparison, its industry has an average forward P/E of 11.90, which means EPM is trading at a discount to the group.
Murphy USA is valued at around $6.93 billion. In the past year, its shares have risen 17.5%.
MUSA currently pays a dividend of $1.52 per share, or 0.48% on an annual basis. Its payout ratio currently sits at 6% of earnings.
NGL Energy Partners is valued at around $497.37 million. In the past year, its units have risen 167.4%.
The partnership currently has a forward P/E ratio of 4.33. In comparison, its industry has an average forward P/E of 15.80, which means NGL is trading at a discount to the group.
Want the latest recommendations from Zacks Investment Research? Today, you can download 7 Best Stocks for the Next 30 Days. Click to get this free report
Oceaneering International, Inc. (OII) : Free Stock Analysis Report
Murphy USA Inc. (MUSA) : Free Stock Analysis Report
NGL Energy Partners LP (NGL) : Free Stock Analysis Report
Evolution Petroleum Corporation, Inc. (EPM) : Free Stock Analysis Report
