Is The ODP Corporation's (NASDAQ:ODP) Recent Stock Performance Influenced By Its Fundamentals In Any Way?
ODP's (NASDAQ:ODP) stock is up by a considerable 12% over the past three months. We wonder if and what role the company's financials play in that price change as a company's long-term fundamentals usually dictate market outcomes. Specifically, we decided to study ODP's ROE in this article.
Return on equity or ROE is a key measure used to assess how efficiently a company's management is utilizing the company's capital. Simply put, it is used to assess the profitability of a company in relation to its equity capital.
View our latest analysis for ODP
How Is ROE Calculated?
Return on equity can be calculated by using the formula:
Return on Equity = Net Profit (from continuing operations) ÷ Shareholders' Equity
So, based on the above formula, the ROE for ODP is:
12% = US$174m ÷ US$1.5b (Based on the trailing twelve months to September 2022).
The 'return' is the income the business earned over the last year. That means that for every $1 worth of shareholders' equity, the company generated $0.12 in profit.
Why Is ROE Important For Earnings Growth?
We have already established that ROE serves as an efficient profit-generating gauge for a company's future earnings. Based on how much of its profits the company chooses to reinvest or "retain", we are then able to evaluate a company's future ability to generate profits. Generally speaking, other things being equal, firms with a high return on equity and profit retention, have a higher growth rate than firms that don’t share these attributes.
A Side By Side comparison of ODP's Earnings Growth And 12% ROE
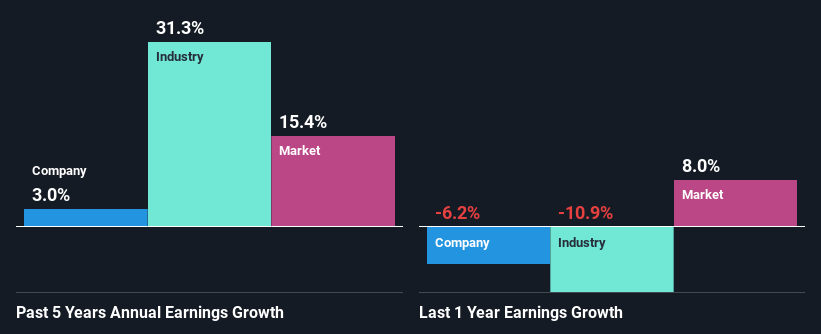
To start with, ODP's ROE looks acceptable. Be that as it may, the company's ROE is still quite lower than the industry average of 27%. On further research, we found that ODP's net income growth of 3.0% over the past five years is quite low. Not to forget, the company does have a decent ROE to begin with, just that it is lower than the industry average. So there might be other reasons for the earnings growth to be low. These include low earnings retention or poor capital allocation.
As a next step, we compared ODP's net income growth with the industry and were disappointed to see that the company's growth is lower than the industry average growth of 31% in the same period.
Earnings growth is an important metric to consider when valuing a stock. What investors need to determine next is if the expected earnings growth, or the lack of it, is already built into the share price. Doing so will help them establish if the stock's future looks promising or ominous. One good indicator of expected earnings growth is the P/E ratio which determines the price the market is willing to pay for a stock based on its earnings prospects. So, you may want to check if ODP is trading on a high P/E or a low P/E, relative to its industry.
Is ODP Using Its Retained Earnings Effectively?
ODP doesn't pay any dividend currently which essentially means that it has been reinvesting all of its profits into the business. This doesn't explain the low earnings growth number that we discussed above. So there might be other factors at play here which could potentially be hampering growth. For example, the business has faced some headwinds.
Conclusion
Overall, we feel that ODP certainly does have some positive factors to consider. Yet, the low earnings growth is a bit concerning, especially given that the company has a respectable rate of return and is reinvesting a huge portion of its profits. By the looks of it, there could be some other factors, not necessarily in control of the business, that's preventing growth. We also studied the latest analyst forecasts and found that the company's earnings growth is expected be similar to its current growth rate. To know more about the company's future earnings growth forecasts take a look at this free report on analyst forecasts for the company to find out more.
Have feedback on this article? Concerned about the content? Get in touch with us directly. Alternatively, email editorial-team (at) simplywallst.com.
This article by Simply Wall St is general in nature. We provide commentary based on historical data and analyst forecasts only using an unbiased methodology and our articles are not intended to be financial advice. It does not constitute a recommendation to buy or sell any stock, and does not take account of your objectives, or your financial situation. We aim to bring you long-term focused analysis driven by fundamental data. Note that our analysis may not factor in the latest price-sensitive company announcements or qualitative material. Simply Wall St has no position in any stocks mentioned.
Join A Paid User Research Session
You’ll receive a US$30 Amazon Gift card for 1 hour of your time while helping us build better investing tools for the individual investors like yourself. Sign up here
