Old Republic International Corporation's (NYSE:ORI) Stock Has Fared Decently: Is the Market Following Strong Financials?
Most readers would already know that Old Republic International's (NYSE:ORI) stock increased by 2.8% over the past month. Given its impressive performance, we decided to study the company's key financial indicators as a company's long-term fundamentals usually dictate market outcomes. Particularly, we will be paying attention to Old Republic International's ROE today.
Return on equity or ROE is a key measure used to assess how efficiently a company's management is utilizing the company's capital. Put another way, it reveals the company's success at turning shareholder investments into profits.
View our latest analysis for Old Republic International
How Do You Calculate Return On Equity?
The formula for ROE is:
Return on Equity = Net Profit (from continuing operations) ÷ Shareholders' Equity
So, based on the above formula, the ROE for Old Republic International is:
11% = US$686m ÷ US$6.2b (Based on the trailing twelve months to December 2022).
The 'return' is the amount earned after tax over the last twelve months. That means that for every $1 worth of shareholders' equity, the company generated $0.11 in profit.
What Has ROE Got To Do With Earnings Growth?
Thus far, we have learned that ROE measures how efficiently a company is generating its profits. We now need to evaluate how much profit the company reinvests or "retains" for future growth which then gives us an idea about the growth potential of the company. Assuming everything else remains unchanged, the higher the ROE and profit retention, the higher the growth rate of a company compared to companies that don't necessarily bear these characteristics.
Old Republic International's Earnings Growth And 11% ROE
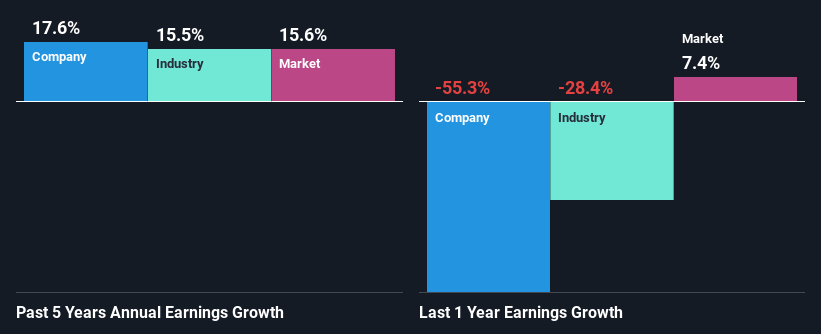
To begin with, Old Republic International seems to have a respectable ROE. Further, the company's ROE is similar to the industry average of 12%. Consequently, this likely laid the ground for the decent growth of 18% seen over the past five years by Old Republic International.
As a next step, we compared Old Republic International's net income growth with the industry and found that the company has a similar growth figure when compared with the industry average growth rate of 15% in the same period.
Earnings growth is an important metric to consider when valuing a stock. It’s important for an investor to know whether the market has priced in the company's expected earnings growth (or decline). Doing so will help them establish if the stock's future looks promising or ominous. If you're wondering about Old Republic International's's valuation, check out this gauge of its price-to-earnings ratio, as compared to its industry.
Is Old Republic International Making Efficient Use Of Its Profits?
Old Republic International has a three-year median payout ratio of 28%, which implies that it retains the remaining 72% of its profits. This suggests that its dividend is well covered, and given the decent growth seen by the company, it looks like management is reinvesting its earnings efficiently.
Moreover, Old Republic International is determined to keep sharing its profits with shareholders which we infer from its long history of paying a dividend for at least ten years. Upon studying the latest analysts' consensus data, we found that the company's future payout ratio is expected to rise to 39% over the next three years. Regardless, the ROE is not expected to change much for the company despite the higher expected payout ratio.
Conclusion
Overall, we are quite pleased with Old Republic International's performance. Particularly, we like that the company is reinvesting heavily into its business, and at a high rate of return. Unsurprisingly, this has led to an impressive earnings growth. Having said that, the company's earnings growth is expected to slow down, as forecasted in the current analyst estimates. To know more about the latest analysts predictions for the company, check out this visualization of analyst forecasts for the company.
Have feedback on this article? Concerned about the content? Get in touch with us directly. Alternatively, email editorial-team (at) simplywallst.com.
This article by Simply Wall St is general in nature. We provide commentary based on historical data and analyst forecasts only using an unbiased methodology and our articles are not intended to be financial advice. It does not constitute a recommendation to buy or sell any stock, and does not take account of your objectives, or your financial situation. We aim to bring you long-term focused analysis driven by fundamental data. Note that our analysis may not factor in the latest price-sensitive company announcements or qualitative material. Simply Wall St has no position in any stocks mentioned.
Join A Paid User Research Session
You’ll receive a US$30 Amazon Gift card for 1 hour of your time while helping us build better investing tools for the individual investors like yourself. Sign up here
