Ollie's Bargain (OLLI) Beats on Q2 Earnings, Raises FY23 View
Ollie's Bargain Outlet Holdings, Inc. OLLI reported second-quarter fiscal 2023 results, wherein both the top and bottom lines beat the Zacks Consensus Estimate. Markedly, both metrics grew year over year. This Harrisburg, PA-based company also registered an increase in comparable store sales.
Favorable responses to deals with product offerings appealing to a broader customer base have been contributing to Ollie's Bargain’s performance. Stellar second-quarter results and continued momentum in the business prompted management to lift the fiscal 2023 view.
Here’s How the Top & Bottom Lines Fared
This extreme-value retailer of brand-name merchandise posted adjusted earnings of 67 cents a share, which comfortably beat the Zacks Consensus Estimate of 61 cents and increased meaningfully from 22 cents reported in the year-ago quarter.
Net sales of $514.5 million jumped 13.7% year over year due to a comparable store sales increase and new store unit growth. The top line came ahead of the consensus mark of $498 million and marked the third straight beat.
We note that comparable store sales rose 7.9% in the quarter under discussion compared with the 1.2% increase registered in the prior-year period. The reported figure also fared better than our expectation of 2.5% growth.
Ollie's Bargain Outlet Holdings, Inc. Price, Consensus and EPS Surprise
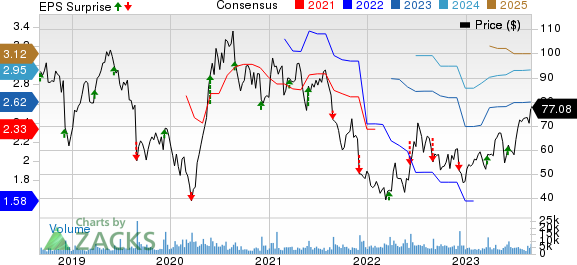
Ollie's Bargain Outlet Holdings, Inc. price-consensus-eps-surprise-chart | Ollie's Bargain Outlet Holdings, Inc. Quote
A Look Into Margins
The gross profit grew 37% to $196.7 million during the quarter. The gross margin expanded 650 basis points to 38.2% due to favorable supply-chain costs as well as higher merchandise margins. We had anticipated 680 basis points of gross margin expansion.
SG&A expenses shot up 13.6% to $134.6 million from the prior-year quarter’s level due to an increase in selling expenses associated with new store openings and higher incentive compensation. As a percentage of net sales, SG&A expenses remain unchanged at 26.2%.
The operating income surged 217.5% to $52.5 million, while the operating margin expanded 650 basis points to 10.2%. Adjusted EBITDA advanced 146.7% to $64 million during the quarter under review. The adjusted EBITDA margin increased 670 basis points to 12.4%.
We had projected a year-over-year jump of 620 basis points and 630 basis points in the gross margin and adjusted EBTDA margin rates, respectively, for the quarter under review.
Store Update
During the quarter, Ollie’s Bargain opened six new stores, thereby bringing the total count to 482 stores in 29 states at the end of the period. This reflected an increase of 7.3% in the store count on a year-over-year basis. The company plans to open 44 new stores in fiscal 2023.
Other Financial Aspects
Ollie’s Bargain ended the quarter with cash and cash equivalents of $181.4 million. The company had no borrowings outstanding under its $100 million revolving credit facility and $91.6 million of availability under the facility as of the end of the quarter.
As of Jul 29, 2023, Ollie’s Bargain’s total borrowings (consisting solely of finance lease obligations) were $1.7 million. Inventories, as of the end of the second quarter, increased 0.8% to $498.3 million.
During the quarter, the company incurred capital expenditures of $26.2 million. For fiscal 2023, management projected capital expenditures of $125 million.
During the quarter under discussion, Ollie’s Bargain repurchased 276,758 shares worth $16.7 million. The company had $109.2 million remaining under its share repurchase program.
Guidance
Management now envisions fiscal 2023 net sales between $2.076 billion and $2.091 billion, suggesting an increase from $1.827 billion reported in fiscal 2022. Ollie’s Bargain now anticipates comparable store sales to rise in the band of 4-4.5% against the comparable store sales decline of 3% reported last fiscal year.
The company had earlier guided net sales in the band of $2.052-$2.067 billion and comparable store sales growth of 2% to 2.8%.
Ollie’s Bargain envisions the gross margin rate in the bracket of 39.1-39.3% for fiscal 2023. The company had reported a gross margin of 35.9% in the last fiscal year. Ollie’s Bargain now anticipates an operating income in the range of $212-$219 million for fiscal 2023, up from $130 million reported in fiscal 2022.
Management now foresees fiscal 2023 adjusted earnings in the range of $2.65-$2.74 per share, up from the adjusted earnings of $1.62 reported last fiscal. The company had earlier projected adjusted earnings between $2.56 and $2.65 per share.
Shares of this Zacks Rank #2 (Buy) company have advanced 33.6% in the past three months against the industry’s decline of 7.3%.
3 More Picks You Can’t Miss Out On
Here we have highlighted three other top-ranked stocks, namely Grocery Outlet GO, Ross Stores ROST and Walmart WMT.
Grocery Outlet, the extreme value retailer of quality, name-brand consumables and fresh products, currently carries a Zacks Rank #2. The expected EPS growth rate for three to five years is 12.3%. You can see the complete list of today’s Zacks #1 Rank (Strong Buy) stocks here.
The Zacks Consensus Estimate for Grocery Outlet’s current financial-year sales and earnings suggests growth of 11.2% and 3.9%, respectively, from the year-ago reported numbers. GO has a trailing four-quarter earnings surprise of 14.3%, on average.
Ross Stores, which operates off-price retail apparel and home fashion stores, currently carries a Zacks Rank #2. The expected EPS growth rate for three to five years is 11.6%.
The Zacks Consensus Estimate for Ross Stores’ current financial-year sales and earnings suggests growth of 7% and 19.4%, respectively, from the year-ago reported numbers. ROST has a trailing four-quarter earnings surprise of 11.4%, on average.
Walmart, which operates a chain of hypermarkets, discount department stores and grocery stores, currently carries a Zacks Rank #2. The expected EPS growth rate for three to five years is 6.6%.
The Zacks Consensus Estimate for Walmart’s current financial-year sales and earnings suggests growth of 5% and 2.1%, respectively, from the year-ago reported numbers. WMT has a trailing four-quarter earnings surprise of 11.6%, on average.
Want the latest recommendations from Zacks Investment Research? Today, you can download 7 Best Stocks for the Next 30 Days. Click to get this free report
Walmart Inc. (WMT) : Free Stock Analysis Report
Ross Stores, Inc. (ROST) : Free Stock Analysis Report
Ollie's Bargain Outlet Holdings, Inc. (OLLI) : Free Stock Analysis Report
Grocery Outlet Holding Corp. (GO) : Free Stock Analysis Report
