Omega Flex, Inc.'s (NASDAQ:OFLX) Stock Has Seen Strong Momentum: Does That Call For Deeper Study Of Its Financial Prospects?
Most readers would already be aware that Omega Flex's (NASDAQ:OFLX) stock increased significantly by 7.0% over the past week. We wonder if and what role the company's financials play in that price change as a company's long-term fundamentals usually dictate market outcomes. In this article, we decided to focus on Omega Flex's ROE.
Return on equity or ROE is a key measure used to assess how efficiently a company's management is utilizing the company's capital. In simpler terms, it measures the profitability of a company in relation to shareholder's equity.
Check out our latest analysis for Omega Flex
How Is ROE Calculated?
Return on equity can be calculated by using the formula:
Return on Equity = Net Profit (from continuing operations) ÷ Shareholders' Equity
So, based on the above formula, the ROE for Omega Flex is:
44% = US$22m ÷ US$50m (Based on the trailing twelve months to March 2021).
The 'return' is the profit over the last twelve months. Another way to think of that is that for every $1 worth of equity, the company was able to earn $0.44 in profit.
What Has ROE Got To Do With Earnings Growth?
We have already established that ROE serves as an efficient profit-generating gauge for a company's future earnings. We now need to evaluate how much profit the company reinvests or "retains" for future growth which then gives us an idea about the growth potential of the company. Assuming everything else remains unchanged, the higher the ROE and profit retention, the higher the growth rate of a company compared to companies that don't necessarily bear these characteristics.
A Side By Side comparison of Omega Flex's Earnings Growth And 44% ROE
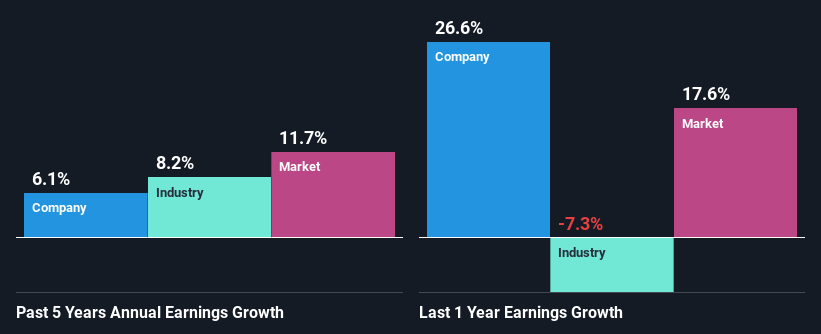
Firstly, we acknowledge that Omega Flex has a significantly high ROE. Additionally, the company's ROE is higher compared to the industry average of 12% which is quite remarkable. This probably laid the groundwork for Omega Flex's moderate 6.1% net income growth seen over the past five years.
We then compared Omega Flex's net income growth with the industry and found that the company's growth figure is lower than the average industry growth rate of 8.2% in the same period, which is a bit concerning.
Earnings growth is a huge factor in stock valuation. The investor should try to establish if the expected growth or decline in earnings, whichever the case may be, is priced in. Doing so will help them establish if the stock's future looks promising or ominous. One good indicator of expected earnings growth is the P/E ratio which determines the price the market is willing to pay for a stock based on its earnings prospects. So, you may want to check if Omega Flex is trading on a high P/E or a low P/E, relative to its industry.
Is Omega Flex Efficiently Re-investing Its Profits?
Omega Flex has a significant three-year median payout ratio of 57%, meaning that it is left with only 43% to reinvest into its business. This implies that the company has been able to achieve decent earnings growth despite returning most of its profits to shareholders.
Moreover, Omega Flex is determined to keep sharing its profits with shareholders which we infer from its long history of seven years of paying a dividend.
Summary
Overall, we feel that Omega Flex certainly does have some positive factors to consider. Its earnings have grown respectably as we saw earlier, which was likely due to the company reinvesting its earnings at a pretty high rate of return. However, given the high ROE, we do think that the company is reinvesting a small portion of its profits. This could likely be preventing the company from growing to its full extent. So far, we've only made a quick discussion around the company's earnings growth. To gain further insights into Omega Flex's past profit growth, check out this visualization of past earnings, revenue and cash flows.
This article by Simply Wall St is general in nature. It does not constitute a recommendation to buy or sell any stock, and does not take account of your objectives, or your financial situation. We aim to bring you long-term focused analysis driven by fundamental data. Note that our analysis may not factor in the latest price-sensitive company announcements or qualitative material. Simply Wall St has no position in any stocks mentioned.
Have feedback on this article? Concerned about the content? Get in touch with us directly. Alternatively, email editorial-team (at) simplywallst.com.
