Ondas Holdings Inc. (NASDAQ:ONDS) Shares Could Be 32% Above Their Intrinsic Value Estimate
Key Insights
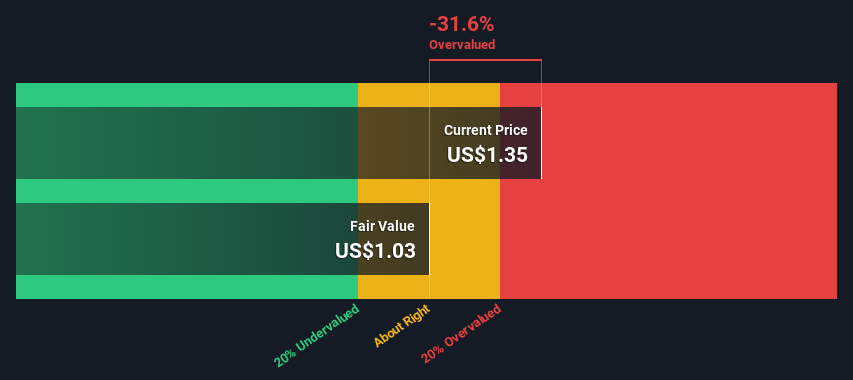
Ondas Holdings' estimated fair value is US$1.03 based on 2 Stage Free Cash Flow to Equity
Ondas Holdings is estimated to be 32% overvalued based on current share price of US$1.35
Analyst price target for ONDS is US$2.75, which is 168% above our fair value estimate
How far off is Ondas Holdings Inc. (NASDAQ:ONDS) from its intrinsic value? Using the most recent financial data, we'll take a look at whether the stock is fairly priced by taking the expected future cash flows and discounting them to their present value. Our analysis will employ the Discounted Cash Flow (DCF) model. It may sound complicated, but actually it is quite simple!
We would caution that there are many ways of valuing a company and, like the DCF, each technique has advantages and disadvantages in certain scenarios. For those who are keen learners of equity analysis, the Simply Wall St analysis model here may be something of interest to you.
Check out our latest analysis for Ondas Holdings
Crunching The Numbers
We're using the 2-stage growth model, which simply means we take in account two stages of company's growth. In the initial period the company may have a higher growth rate and the second stage is usually assumed to have a stable growth rate. To start off with, we need to estimate the next ten years of cash flows. Where possible we use analyst estimates, but when these aren't available we extrapolate the previous free cash flow (FCF) from the last estimate or reported value. We assume companies with shrinking free cash flow will slow their rate of shrinkage, and that companies with growing free cash flow will see their growth rate slow, over this period. We do this to reflect that growth tends to slow more in the early years than it does in later years.
A DCF is all about the idea that a dollar in the future is less valuable than a dollar today, and so the sum of these future cash flows is then discounted to today's value:
10-year free cash flow (FCF) estimate
2024 | 2025 | 2026 | 2027 | 2028 | 2029 | 2030 | 2031 | 2032 | 2033 | |
Levered FCF ($, Millions) | -US$13.3m | US$882.0k | US$1.52m | US$2.31m | US$3.16m | US$3.99m | US$4.75m | US$5.42m | US$5.99m | US$6.48m |
Growth Rate Estimate Source | Analyst x2 | Analyst x1 | Est @ 72.71% | Est @ 51.56% | Est @ 36.76% | Est @ 26.40% | Est @ 19.14% | Est @ 14.07% | Est @ 10.51% | Est @ 8.03% |
Present Value ($, Millions) Discounted @ 8.1% | -US$12.3 | US$0.8 | US$1.2 | US$1.7 | US$2.1 | US$2.5 | US$2.8 | US$2.9 | US$3.0 | US$3.0 |
("Est" = FCF growth rate estimated by Simply Wall St)
Present Value of 10-year Cash Flow (PVCF) = US$7.6m
The second stage is also known as Terminal Value, this is the business's cash flow after the first stage. For a number of reasons a very conservative growth rate is used that cannot exceed that of a country's GDP growth. In this case we have used the 5-year average of the 10-year government bond yield (2.2%) to estimate future growth. In the same way as with the 10-year 'growth' period, we discount future cash flows to today's value, using a cost of equity of 8.1%.
Terminal Value (TV)= FCF2033 × (1 + g) ÷ (r – g) = US$6.5m× (1 + 2.2%) ÷ (8.1%– 2.2%) = US$113m
Present Value of Terminal Value (PVTV)= TV / (1 + r)10= US$113m÷ ( 1 + 8.1%)10= US$52m
The total value, or equity value, is then the sum of the present value of the future cash flows, which in this case is US$60m. The last step is to then divide the equity value by the number of shares outstanding. Relative to the current share price of US$1.4, the company appears reasonably expensive at the time of writing. Remember though, that this is just an approximate valuation, and like any complex formula - garbage in, garbage out.
The Assumptions
We would point out that the most important inputs to a discounted cash flow are the discount rate and of course the actual cash flows. If you don't agree with these result, have a go at the calculation yourself and play with the assumptions. The DCF also does not consider the possible cyclicality of an industry, or a company's future capital requirements, so it does not give a full picture of a company's potential performance. Given that we are looking at Ondas Holdings as potential shareholders, the cost of equity is used as the discount rate, rather than the cost of capital (or weighted average cost of capital, WACC) which accounts for debt. In this calculation we've used 8.1%, which is based on a levered beta of 1.168. Beta is a measure of a stock's volatility, compared to the market as a whole. We get our beta from the industry average beta of globally comparable companies, with an imposed limit between 0.8 and 2.0, which is a reasonable range for a stable business.
SWOT Analysis for Ondas Holdings
Strength
Debt is well covered by earnings.
Weakness
Shareholders have been diluted in the past year.
Opportunity
Forecast to reduce losses next year.
Good value based on P/S ratio compared to estimated Fair P/S ratio.
Significant insider buying over the past 3 months.
Threat
Debt is not well covered by operating cash flow.
Has less than 3 years of cash runway based on current free cash flow.
Not expected to become profitable over the next 3 years.
Looking Ahead:
Valuation is only one side of the coin in terms of building your investment thesis, and it shouldn't be the only metric you look at when researching a company. The DCF model is not a perfect stock valuation tool. Rather it should be seen as a guide to "what assumptions need to be true for this stock to be under/overvalued?" For example, changes in the company's cost of equity or the risk free rate can significantly impact the valuation. What is the reason for the share price exceeding the intrinsic value? For Ondas Holdings, there are three further items you should consider:
Risks: You should be aware of the 5 warning signs for Ondas Holdings (1 doesn't sit too well with us!) we've uncovered before considering an investment in the company.
Management:Have insiders been ramping up their shares to take advantage of the market's sentiment for ONDS's future outlook? Check out our management and board analysis with insights on CEO compensation and governance factors.
Other High Quality Alternatives: Do you like a good all-rounder? Explore our interactive list of high quality stocks to get an idea of what else is out there you may be missing!
PS. The Simply Wall St app conducts a discounted cash flow valuation for every stock on the NASDAQCM every day. If you want to find the calculation for other stocks just search here.
Have feedback on this article? Concerned about the content? Get in touch with us directly. Alternatively, email editorial-team (at) simplywallst.com.
This article by Simply Wall St is general in nature. We provide commentary based on historical data and analyst forecasts only using an unbiased methodology and our articles are not intended to be financial advice. It does not constitute a recommendation to buy or sell any stock, and does not take account of your objectives, or your financial situation. We aim to bring you long-term focused analysis driven by fundamental data. Note that our analysis may not factor in the latest price-sensitive company announcements or qualitative material. Simply Wall St has no position in any stocks mentioned.
