Ooma, Inc. (NYSE:OOMA) Stock's Been Sliding But Fundamentals Look Decent: Will The Market Correct The Share Price In The Future?
Ooma (NYSE:OOMA) has had a rough three months with its share price down 15%. However, stock prices are usually driven by a company’s financials over the long term, which in this case look pretty respectable. Specifically, we decided to study Ooma's ROE in this article.
Return on Equity or ROE is a test of how effectively a company is growing its value and managing investors’ money. Put another way, it reveals the company's success at turning shareholder investments into profits.
See our latest analysis for Ooma
How Is ROE Calculated?
ROE can be calculated by using the formula:
Return on Equity = Net Profit (from continuing operations) ÷ Shareholders' Equity
So, based on the above formula, the ROE for Ooma is:
2.3% = US$1.8m ÷ US$78m (Based on the trailing twelve months to October 2023).
The 'return' is the income the business earned over the last year. Another way to think of that is that for every $1 worth of equity, the company was able to earn $0.02 in profit.
What Has ROE Got To Do With Earnings Growth?
We have already established that ROE serves as an efficient profit-generating gauge for a company's future earnings. Depending on how much of these profits the company reinvests or "retains", and how effectively it does so, we are then able to assess a company’s earnings growth potential. Generally speaking, other things being equal, firms with a high return on equity and profit retention, have a higher growth rate than firms that don’t share these attributes.
Ooma's Earnings Growth And 2.3% ROE
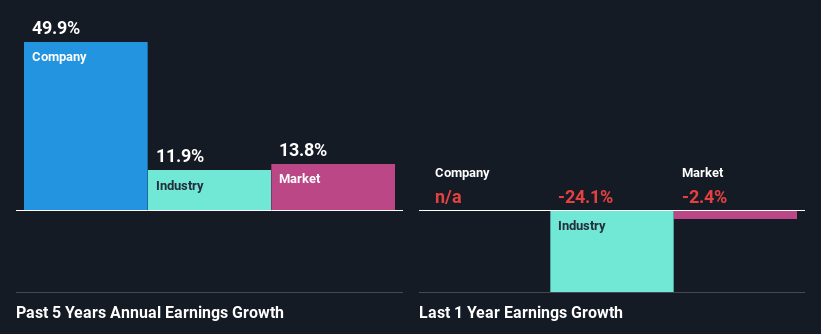
It is quite clear that Ooma's ROE is rather low. Not just that, even compared to the industry average of 7.2%, the company's ROE is entirely unremarkable. In spite of this, Ooma was able to grow its net income considerably, at a rate of 50% in the last five years. We reckon that there could be other factors at play here. For example, it is possible that the company's management has made some good strategic decisions, or that the company has a low payout ratio.
Next, on comparing with the industry net income growth, we found that Ooma's growth is quite high when compared to the industry average growth of 12% in the same period, which is great to see.
Earnings growth is an important metric to consider when valuing a stock. What investors need to determine next is if the expected earnings growth, or the lack of it, is already built into the share price. This then helps them determine if the stock is placed for a bright or bleak future. One good indicator of expected earnings growth is the P/E ratio which determines the price the market is willing to pay for a stock based on its earnings prospects. So, you may want to check if Ooma is trading on a high P/E or a low P/E, relative to its industry.
Is Ooma Efficiently Re-investing Its Profits?
Given that Ooma doesn't pay any dividend to its shareholders, we infer that the company has been reinvesting all of its profits to grow its business.
Summary
In total, it does look like Ooma has some positive aspects to its business. With a high rate of reinvestment, albeit at a low ROE, the company has managed to see a considerable growth in its earnings. The latest industry analyst forecasts show that the company is expected to maintain its current growth rate. To know more about the latest analysts predictions for the company, check out this visualization of analyst forecasts for the company.
Have feedback on this article? Concerned about the content? Get in touch with us directly. Alternatively, email editorial-team (at) simplywallst.com.
This article by Simply Wall St is general in nature. We provide commentary based on historical data and analyst forecasts only using an unbiased methodology and our articles are not intended to be financial advice. It does not constitute a recommendation to buy or sell any stock, and does not take account of your objectives, or your financial situation. We aim to bring you long-term focused analysis driven by fundamental data. Note that our analysis may not factor in the latest price-sensitive company announcements or qualitative material. Simply Wall St has no position in any stocks mentioned.
