OpenSea Activity Has Slowed Down Since the Beginning of February
January was a big month in the NFT market, having approximately $16 billion of trading volume.
OpenSea had its highest trading monthly volume of $4.21 billion, surpassing its previous record high of $3.31 billion in August 2021.
This month, things don’t look as good as last month in terms of NFT metrics in OpenSea. According to Dune Analytics data, metrics like daily active users, ETH total daily volume, and NFTs sold per user have been cooling off since the beginning of the month.
Deep Dive on OpenSea’s On-Chain Data
The analysis of the different metrics of the NFT marketplace is from Dune Analytics data.
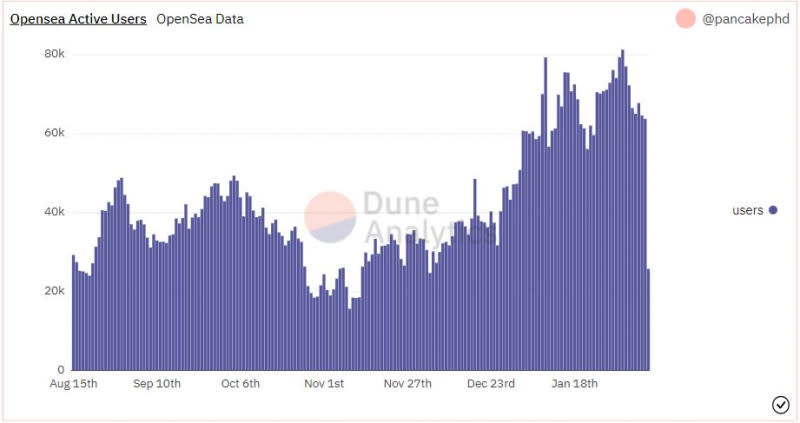
The first point analyzed was the daily active users. The downturn began on February 2nd with 81,324 users. As of February 9, there were 63,794 users, which is a 21.5% drawdown from its monthly top of February 2nd, as you see in the chart below:
The second point analyzed was the ETH daily volume, which is the metric that has declined the most. The decline began on February 1st with 130,318 ETH volume traded. As of February 9, there were 45,710 ETH volume traded, this means that it is down 64.9% de from its monthly top of February 1st, as you see in the chart below:

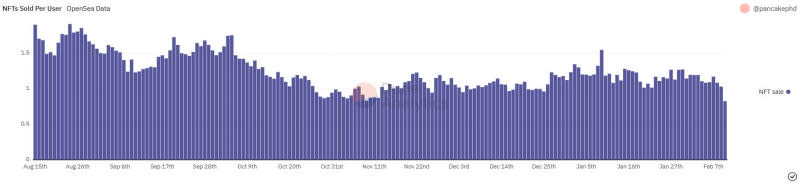
The third and last point analyzed was the NFTs sold per user. The decline began on February 1st with 1.20 NFTs sold per user. As of February 9, data shows 1.03 NFTs were sold per user, that is a 14.16% from its monthly top of February 1st, as you see in the chart below:
Now that we have analyzed the metrics, let’s take a look at ETH’s recent price actions.
What’s Been Happening With the Price of ETH?
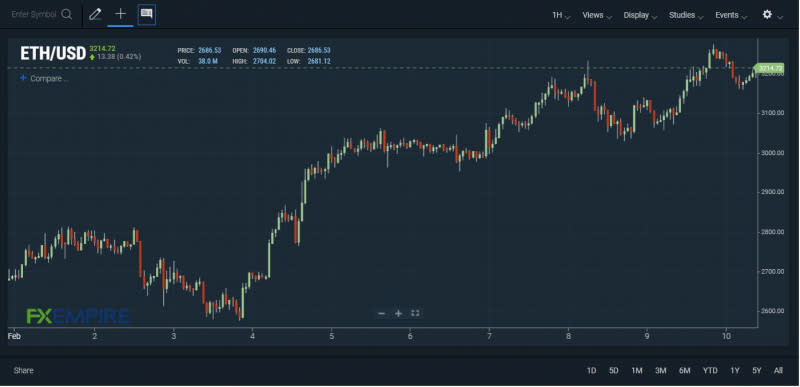
ETH is the second-biggest cryptocurrency by market capitalization with $383 billion, according to CoinMarketCap. It is trading at $3,214.72 and it is up 2.50% in the last 24 hours.
The cryptocurrency is still down 33.41% from its all-time high of $4,828.32 in November 2021. ETH is up 20% since it found support around $2,570 on February 3 and began with an ascending channel, as you can see below:
As on-chain data showed, it appears that the NFT market is taking a breath during the first days of the month, but ETH’s price is not.
It looks like the attention of NFT traders on OpenSea is shifting to ETH’s price action movements, but let’s see if OpenSea can increase its activity again with possible upcoming features such as the support of other networks like Solana.
This article was originally posted on FX Empire
