Optimism for Fidelity National Financial (NYSE:FNF) has grown this past week, despite one-year decline in earnings
These days it's easy to simply buy an index fund, and your returns should (roughly) match the market. But if you pick the right individual stocks, you could make more than that. To wit, the Fidelity National Financial, Inc. (NYSE:FNF) share price is 58% higher than it was a year ago, much better than the market return of around 31% (not including dividends) in the same period. So that should have shareholders smiling. Looking back further, the stock price is 30% higher than it was three years ago.
On the back of a solid 7-day performance, let's check what role the company's fundamentals have played in driving long term shareholder returns.
See our latest analysis for Fidelity National Financial
While markets are a powerful pricing mechanism, share prices reflect investor sentiment, not just underlying business performance. One flawed but reasonable way to assess how sentiment around a company has changed is to compare the earnings per share (EPS) with the share price.
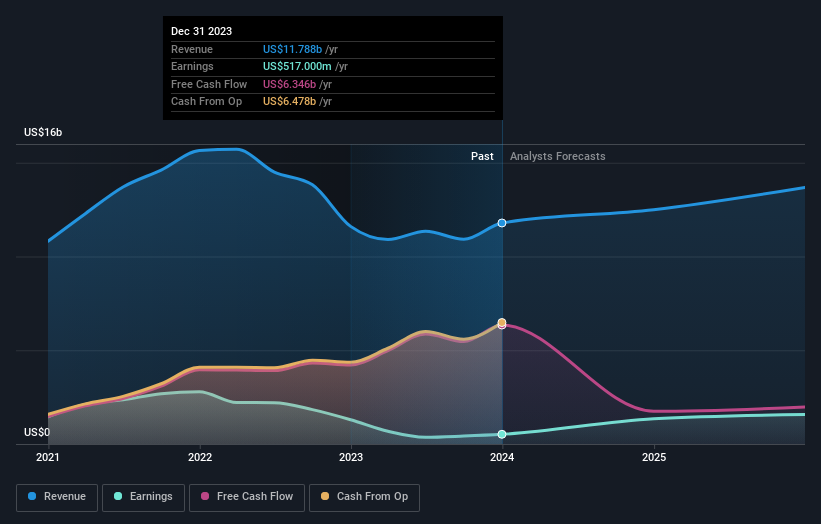
Over the last twelve months, Fidelity National Financial actually shrank its EPS by 59%.
This means it's unlikely the market is judging the company based on earnings growth. Indeed, when EPS is declining but the share price is up, it often means the market is considering other factors.
Revenue was pretty stable on last year, so deeper research might be needed to explain the share price rise.
You can see how earnings and revenue have changed over time in the image below (click on the chart to see the exact values).
Balance sheet strength is crucial. It might be well worthwhile taking a look at our free report on how its financial position has changed over time.
What About Dividends?
When looking at investment returns, it is important to consider the difference between total shareholder return (TSR) and share price return. Whereas the share price return only reflects the change in the share price, the TSR includes the value of dividends (assuming they were reinvested) and the benefit of any discounted capital raising or spin-off. Arguably, the TSR gives a more comprehensive picture of the return generated by a stock. We note that for Fidelity National Financial the TSR over the last 1 year was 65%, which is better than the share price return mentioned above. This is largely a result of its dividend payments!
A Different Perspective
It's nice to see that Fidelity National Financial shareholders have received a total shareholder return of 65% over the last year. Of course, that includes the dividend. That gain is better than the annual TSR over five years, which is 12%. Therefore it seems like sentiment around the company has been positive lately. Someone with an optimistic perspective could view the recent improvement in TSR as indicating that the business itself is getting better with time. It's always interesting to track share price performance over the longer term. But to understand Fidelity National Financial better, we need to consider many other factors. Even so, be aware that Fidelity National Financial is showing 3 warning signs in our investment analysis , you should know about...
Of course, you might find a fantastic investment by looking elsewhere. So take a peek at this free list of companies we expect will grow earnings.
Please note, the market returns quoted in this article reflect the market weighted average returns of stocks that currently trade on American exchanges.
Have feedback on this article? Concerned about the content? Get in touch with us directly. Alternatively, email editorial-team (at) simplywallst.com.
This article by Simply Wall St is general in nature. We provide commentary based on historical data and analyst forecasts only using an unbiased methodology and our articles are not intended to be financial advice. It does not constitute a recommendation to buy or sell any stock, and does not take account of your objectives, or your financial situation. We aim to bring you long-term focused analysis driven by fundamental data. Note that our analysis may not factor in the latest price-sensitive company announcements or qualitative material. Simply Wall St has no position in any stocks mentioned.
