Orbital Infrastructure Group Inc's Performance Dilemma: A Deep Dive into the GF Score Analysis
Long-established in the Construction industry, Orbital Infrastructure Group Inc (NASDAQ:OIG) has enjoyed a stellar reputation. However, it has recently witnessed a decline of 21.23%, juxtaposed with a three-month change of -28.07%. Fresh insights from the GuruFocus Score Rating hint at potential headwinds. Notably, its diminished rankings in financial strength, growth, and valuation suggest that the company might not live up to its historical performance. Join us as we dive deep into these pivotal metrics to unravel the evolving narrative of Orbital Infrastructure Group Inc.
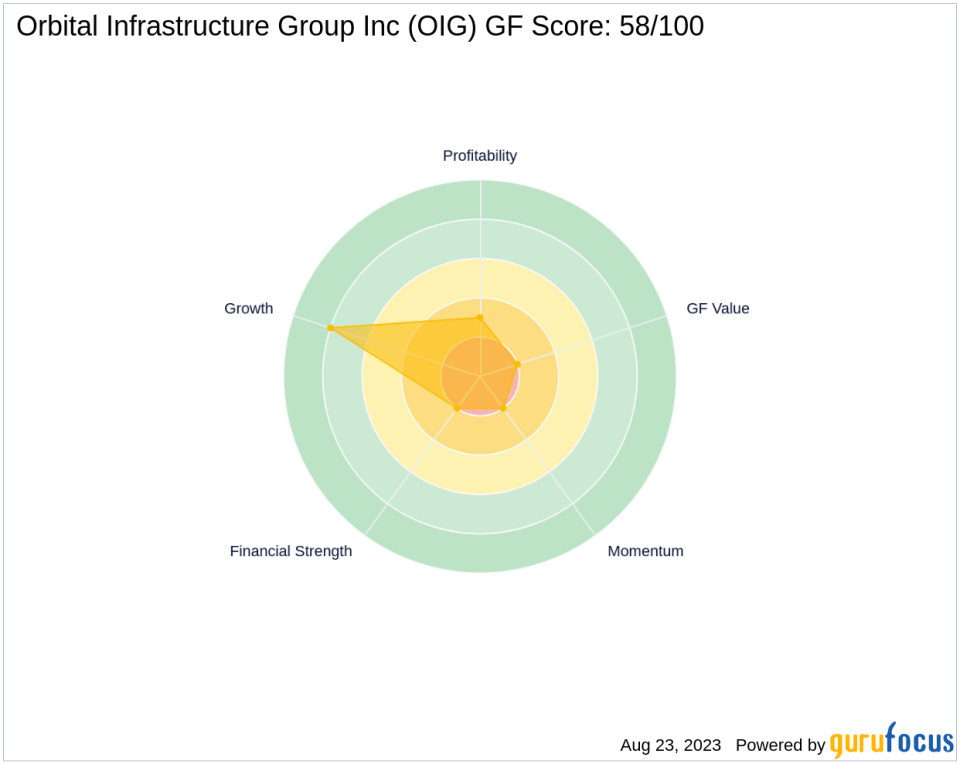
Understanding the GF Score
The GF Score is a stock performance ranking system developed by GuruFocus using five aspects of valuation, which has been found to be closely correlated to the long-term performances of stocks by backtesting from 2006 to 2021. The stocks with a higher GF Score generally generate higher returns than those with a lower GF Score. Therefore, when picking stocks, investors should invest in companies with high GF Scores. The GF Score ranges from 0 to 100, with 100 as the highest rank.
1. Financial strength rank: 2/10
2. Profitability rank: 3/10
3. Growth rank: 8/10
4. GF Value rank: 2/10
5. Momentum rank: 2/10
Based on the above method, GuruFocus assigned Orbital Infrastructure Group Inc the GF Score of 58 out of 100, which signals poor future outperformance potential.
Orbital Infrastructure Group Inc: A Snapshot
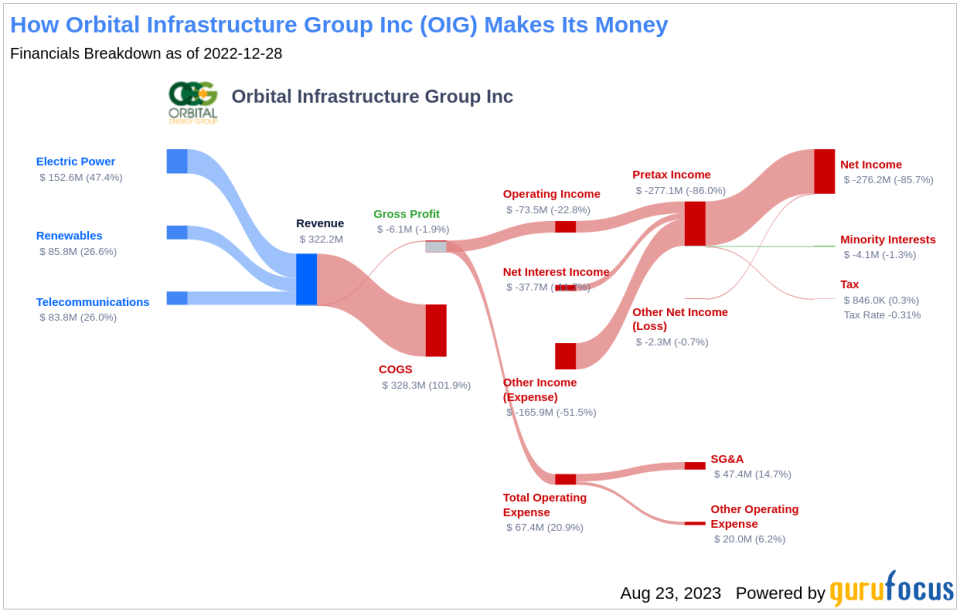
Orbital Infrastructure Group Inc is a diversified infrastructure services platform, providing engineering, design, construction, and maintenance services to customers in three operating segments namely electric power, telecommunications, and renewables. With a market cap of $6.62 billion and sales of $332.15 million, the company has been a significant player in the industry. However, its operating margin of -22.58% raises concerns about its profitability.
Financial Strength Analysis
Orbital Infrastructure Group Inc's financial strength indicators present some concerning insights about the company's balance sheet health. The company has an interest coverage ratio of 0, which positions it worse than 0% of 1219 companies in the Construction industry. This ratio highlights potential challenges the company might face when handling its interest expenses on outstanding debt. The company's Altman Z-Scoreis just -5.45, which is below the distress zone of 1.81. This suggests that the company may face financial distress over the next few years. Additionally, the company's low cash-to-debt ratio at 0.09 indicates a struggle in handling existing debt levels.
Profitability Analysis
Orbital Infrastructure Group Inc's low Profitability rank can also raise warning signals. The company's Gross Margin has also declined over the past five years, as evidenced by the data: 2018: 12.58; 2019: 24.74; 2020: 8.94; 2021: 5.21; 2022: -1.89; . This trend underscores the company's struggles to convert its revenue into profits.
Conclusion
Given the company's financial strength, profitability, and growth metrics, the GuruFocus Score Rating highlights the firm's unparalleled position for potential underperformance. While Orbital Infrastructure Group Inc has a rich history in the construction industry, its current financial indicators suggest that it may struggle to maintain its past performance. Therefore, investors should exercise caution and conduct thorough research before investing in the company.
GuruFocus Premium members can find more companies with strong GF Scores using the following screener link: GF Score Screen
This article first appeared on GuruFocus.
