Orgenesis (ORGS): A Value Trap in Disguise?
Value-focused investors often seek stocks trading below their intrinsic value. One such stock warranting attention is Orgenesis Inc (NASDAQ:ORGS). Despite its current price of $0.6 and a GF Value of $3.83, certain risk factors suggest Orgenesis (NASDAQ:ORGS) might be a potential value trap. This article will unravel the financial complexities of Orgenesis, providing a comprehensive analysis of its value and potential risks.
Understanding GF Value
The GF Value represents the current intrinsic value of a stock, derived from GuruFocus's exclusive method. It is calculated based on historical multiples (PE Ratio, PS Ratio, PB Ratio, and Price-to-Free-Cash-Flow), a GuruFocus adjustment factor based on the company's past returns and growth, and future estimates of the business performance. If the stock price is significantly above the GF Value Line, it is overvalued, and its future return is likely to be poor. Conversely, if it is significantly below the GF Value Line, its future return will likely be higher.
However, before making an investment decision, investors need to consider a more in-depth analysis. Orgenesis's low Altman Z-score of -2.78 and a Beneish M-Score of -1.29 that exceeds -1.78, the threshold for potential earnings manipulation, suggest that Orgenesis might be a potential value trap. This complexity underlines the importance of thorough due diligence in investment decision-making.
Understanding the Altman Z-score and Beneish M-Score
The Altman Z-score is a financial model that predicts the probability of a company entering bankruptcy within a two-year time frame. A score below 1.8 suggests a high likelihood of financial distress, while a score above 3 indicates a low risk. The Beneish M-Score, developed by Professor Messod Beneish, is based on eight financial variables that reflect different aspects of a company's financial performance and position. These include Days Sales Outstanding (DSO), Gross Margin (GM), Total Long-term Assets Less Property, Plant and Equipment over Total Assets (TATA), and others.
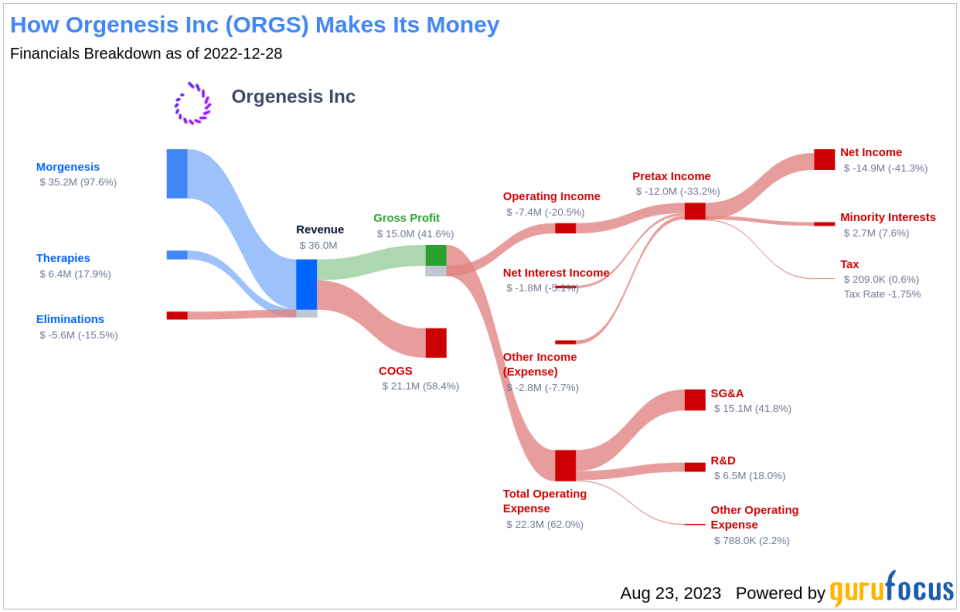
An Overview of Orgenesis Inc (NASDAQ:ORGS)
Orgenesis Inc is a biotech company working to unlock the potential of cell and gene therapies. It is focused on autologous therapies, with processes and systems that are developed for each therapy using a closed and automated processing system approach that is validated for compliant production near the patient for treatment at the point of care (POCare). The company's business includes two reporting segments: Morgenesis and Therapies.
Orgenesis's Low Altman Z-Score: A Breakdown of Key Drivers
An evaluation of Orgenesis's Altman Z-score suggests potential financial distress. The Working Capital to Total Assets ratio, a measure of short-term liquidity, has shown a declining trend over the past few years (2021: 0.01; 2022: -0.01; 2023: -0.02). This decline suggests potential liquidity issues that the company may be facing. The ratio is strikingly low, which unfavorably influences the overall Z-Score.
The Retained Earnings to Total Assets ratio provides insights into a company's capability to reinvest its profits or manage debt. Evaluating Orgenesis's historical data, 2021: -1.21; 2022: -1.84; 2023: -2.37, we observe a declining trend in this ratio. This downward movement indicates Orgenesis's diminishing ability to reinvest in its business or effectively manage its debt. Consequently, it exerts a negative impact on its Z-Score.
The days sales outstanding (DSO) is an important financial metric that denotes the average time a company takes to collect payment after a sale is completed. Looking at the historical data from the past three years (2021: 0.26; 2022: 0.47; 2023: 0.48), there appears to be a rising trend in Orgenesis's DSO. A rising DSO figure warrants scrutiny as it can signal financial distress or questionable accounting practices within the company.
The Gross Margin index tracks the evolution of a company's gross profit as a proportion of its revenue. A downward trend could indicate issues such as overproduction or more generous credit terms, both of which are potential red flags for earnings manipulation. By examining the past three years of Orgenesis's historical data (2021: 27.30; 2022: 50.60; 2023: 69.86), we find that its Gross Margin has contracted by 399.86%. Such a contraction in the gross margin can negatively impact the company's profitability as it signifies lesser income from each dollar of sales. This could put a strain on the company's capacity to manage operating costs, potentially undermining its financial stability.
The asset quality ratio, calculated as Total Long-term Assets minus Property, Plant, and Equipment, divided by Total Assets, gauges the proportion of intangible or less tangible assets within a company's asset structure. Analyzing Orgenesis's asset quality ratio over the past three years (2021: 0.30; 2022: 0.35; 2023: 0.80), an increase might signal underlying issues, such as capitalizing normal operating expenses or goodwill impairment. These factors can inflate assets and mask true operational costs, potentially misrepresenting the company's actual financial position, and raising concerns for investors about its true value and risk profile.
The change in Depreciation, Depletion, and Amortization (DDA) reflects the rate at which a company's assets lose value over time. Analyzing Orgenesis's DDA data over the past three years (2021: 1.61; 2022: 1.92; 2023: 2.18), a decreasing rate might be a cause for concern. This decline may suggest that the company is prolonging the useful life of its assets, possibly to manipulate earnings. By extending the lifespan of assets, depreciation charges are spread over a longer period, thereby reducing annual expenses and artificially boosting reported profits. While this may create a more favorable short-term financial picture, it could also distort the true value and condition of the company's assets, misleading investors and potentially hiding underlying operational or financial issues.
Next is the leverage index, which is computed as the change in the Debt-to-Asset Ratio. An increase in this ratio may suggest that the company is taking on more debt, thereby potentially inflating earnings.
The TATA (Total Accruals to Total Assets) ratio, calculated as the Net Income less Non-Operating Income and Cash Flow from Operations, divided by Total Assets, is a key indicator of the quality of a company's earnings. For Orgenesis, the current TATA ratio (TTM) stands at 0.307. A positive TATA ratio can be a warning sign, suggesting that the earnings are composed more of accruals rather than cash flow, which could be an indication of aggressive income recognition. Accrual accounting permits management some discretion in recognizing revenue and expenses, and a company intent on artificially boosting its earnings might exploit this flexibility.
Conclusion
Despite its seemingly attractive valuation, Orgenesis (NASDAQ:ORGS) exhibits several financial risk factors that suggest it might be a potential value trap. The company's low Altman Z-score, high Beneish M-Score, and various financial ratios all point towards potential financial distress. Therefore, investors should exercise caution and conduct thorough due diligence before investing in Orgenesis.
GuruFocus Premium members can find stocks with high Altman Z-Score using the following Screener: Walter Schloss Screen . To find out the high quality companies that may deliver above average returns, please check out GuruFocus High Quality Low Capex Screener.
This article first appeared on GuruFocus.
