Are Orient Refractories Limited’s (NSE:ORIENTREF) High Returns Really That Great?

Want to participate in a short research study? Help shape the future of investing tools and you could win a $250 gift card!
Today we are going to look at Orient Refractories Limited (NSE:ORIENTREF) to see whether it might be an attractive investment prospect. In particular, we'll consider its Return On Capital Employed (ROCE), as that can give us insight into how profitably the company is able to employ capital in its business.
First of all, we'll work out how to calculate ROCE. Then we'll compare its ROCE to similar companies. Last but not least, we'll look at what impact its current liabilities have on its ROCE.
Return On Capital Employed (ROCE): What is it?
ROCE is a metric for evaluating how much pre-tax income (in percentage terms) a company earns on the capital invested in its business. Generally speaking a higher ROCE is better. In brief, it is a useful tool, but it is not without drawbacks. Renowned investment researcher Michael Mauboussin has suggested that a high ROCE can indicate that 'one dollar invested in the company generates value of more than one dollar'.
So, How Do We Calculate ROCE?
The formula for calculating the return on capital employed is:
Return on Capital Employed = Earnings Before Interest and Tax (EBIT) ÷ (Total Assets - Current Liabilities)
Or for Orient Refractories:
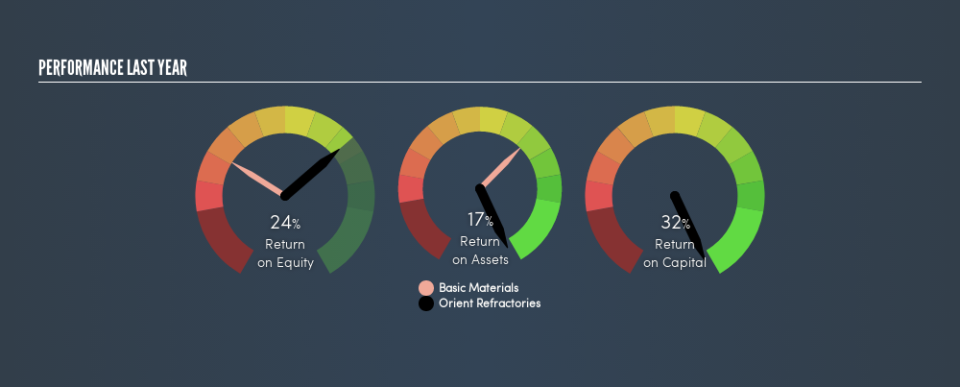
0.32 = ₹1.2b ÷ (₹5.1b - ₹1.3b) (Based on the trailing twelve months to March 2019.)
Therefore, Orient Refractories has an ROCE of 32%.
View our latest analysis for Orient Refractories
Is Orient Refractories's ROCE Good?
ROCE can be useful when making comparisons, such as between similar companies. Orient Refractories's ROCE appears to be substantially greater than the 9.2% average in the Basic Materials industry. We consider this a positive sign, because it suggests it uses capital more efficiently than similar companies. Regardless of the industry comparison, in absolute terms, Orient Refractories's ROCE currently appears to be excellent.
You can click on the image below to see (in greater detail) how Orient Refractories's past growth compares to other companies.
When considering this metric, keep in mind that it is backwards looking, and not necessarily predictive. Companies in cyclical industries can be difficult to understand using ROCE, as returns typically look high during boom times, and low during busts. ROCE is, after all, simply a snap shot of a single year. What happens in the future is pretty important for investors, so we have prepared a free report on analyst forecasts for Orient Refractories.
Orient Refractories's Current Liabilities And Their Impact On Its ROCE
Liabilities, such as supplier bills and bank overdrafts, are referred to as current liabilities if they need to be paid within 12 months. Due to the way ROCE is calculated, a high level of current liabilities makes a company look as though it has less capital employed, and thus can (sometimes unfairly) boost the ROCE. To counter this, investors can check if a company has high current liabilities relative to total assets.
Orient Refractories has total liabilities of ₹1.3b and total assets of ₹5.1b. Therefore its current liabilities are equivalent to approximately 26% of its total assets. The fairly low level of current liabilities won't have much impact on the already great ROCE.
The Bottom Line On Orient Refractories's ROCE
With low current liabilities and a high ROCE, Orient Refractories could be worthy of further investigation. Orient Refractories shapes up well under this analysis, but it is far from the only business delivering excellent numbers . You might also want to check this free collection of companies delivering excellent earnings growth.
If you like to buy stocks alongside management, then you might just love this free list of companies. (Hint: insiders have been buying them).
We aim to bring you long-term focused research analysis driven by fundamental data. Note that our analysis may not factor in the latest price-sensitive company announcements or qualitative material.
If you spot an error that warrants correction, please contact the editor at editorial-team@simplywallst.com. This article by Simply Wall St is general in nature. It does not constitute a recommendation to buy or sell any stock, and does not take account of your objectives, or your financial situation. Simply Wall St has no position in the stocks mentioned. Thank you for reading.
