Overstock.com's (OSTK) Q3 Earnings Beat, Revenues Fall Y/Y
Overstock.com OSTK reported third-quarter 2023 loss of 61 cents per share, which was narrower than the Zacks Consensus Estimate of a loss of 69 cents per share. The bottom line however deteriorated 569.2% year over year.
Revenues of $373.3 million decreased 18.9% year over year and missed the consensus mark by 6.4%.
Revenues were hit by a contraction in demand in the real estate sector. The combination of lower consumer engagement and a weak housing market created constant pressure on the top line in the reported quarter.
Active customers reached 4.907 million at the end of the third quarter of 2023, down 15.3% year over year.
The number of active customers declined due to a fall in home-related spending, change in spending preference and the company’s strategy to shift completely online.
The average order value was $192 in the reported quarter, down 21% year over year. Orders delivered were 1.945 million, up 2.7% year over year.
Overstock.com, Inc. Price, Consensus and EPS Surprise
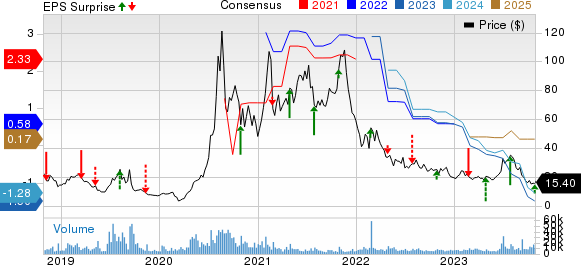
Overstock.com, Inc. price-consensus-eps-surprise-chart | Overstock.com, Inc. Quote
Operating Details
Gross margin contracted 460 basis points (bps) to 18.7% in the reported quarter.
Sales & marketing (S&M) expenses increased 7.5% year over year to $57.5 million. As a percentage of revenues, S&M expenses increased 380 bps to 15.4%.
Technology expenses were $29.2 million, down 1.3% year over year. As a percentage of revenues, technology expenses jumped 140 bps on a year-over-year basis to 7.8%.
General & administrative (G&A) expenses increased 29.2% year over year to $24.1 million. As a percentage of revenues, G&A increased 240 bps to 6.5%.
Adjusted EBITDA was negative $23.9 million, which declined 262% from the year-ago quarter.
Operating loss was $40.9 million against $5.7 million profit reported in the year-ago quarter.
Balance Sheet
As of Sep 30, 2023, OSTK had cash and cash equivalents worth $325.435 million compared with $342.8 million as of Jun 30, 2023.
Long-term debt, as of Sep 30, 2023, was $34.232 million compared with $34.219 million as of Jun 30, 2023.
Zacks Rank & Stocks to Consider
Overstock.com currently carries a Zacks Rank #4 (Sell).
Investors interested in the broader Zacks Retail-wholesale sector can also consider some better-ranked stocks like ACV Auction ACVA, PC Connection CNXN and Builders FirstSource BLDR. While BLDR sports a Zacks Rank #1 (Strong Buy), ACVA and CNXN carry a Zacks Rank #2 (Buy) each at present. You can see the complete list of today’s Zacks #1 Rank stocks here.
ACV Auction is set to report its third-quarter 2023 results on Nov 6. The Zacks Consensus Estimate is pegged at a loss of 7 cents per share, which has decreased by 1 cent over the past 30 days.
PC Connection is slated to report its third-quarter 2023 results on Nov 1. The Zacks Consensus Estimate for CNXN’s third-quarter 2023 earnings is pegged at 81 cents per share, which has decreased by 1 cent over the past 30 days.
Builders FirstSource is scheduled to report its third-quarter 2023 results on Nov 1. The Zacks Consensus Estimate for BLDR’s third-quarter 2023 earnings is pegged at $4.05 per share, which has remained unchanged over the past 30 days.
Want the latest recommendations from Zacks Investment Research? Today, you can download 7 Best Stocks for the Next 30 Days. Click to get this free report
Builders FirstSource, Inc. (BLDR) : Free Stock Analysis Report
Overstock.com, Inc. (OSTK) : Free Stock Analysis Report
PC Connection, Inc. (CNXN) : Free Stock Analysis Report
ACV Auctions Inc. (ACVA) : Free Stock Analysis Report
