What Is The Ownership Structure Like For Prudential plc (LON:PRU)?
The big shareholder groups in Prudential plc (LON:PRU) have power over the company. Large companies usually have institutions as shareholders, and we usually see insiders owning shares in smaller companies. We also tend to see lower insider ownership in companies that were previously publicly owned.
Prudential has a market capitalization of UK£34b, so it's too big to fly under the radar. We'd expect to see both institutions and retail investors owning a portion of the company. Our analysis of the ownership of the company, below, shows that institutions own shares in the company. Let's delve deeper into each type of owner, to discover more about Prudential.
See our latest analysis for Prudential
What Does The Institutional Ownership Tell Us About Prudential?
Many institutions measure their performance against an index that approximates the local market. So they usually pay more attention to companies that are included in major indices.
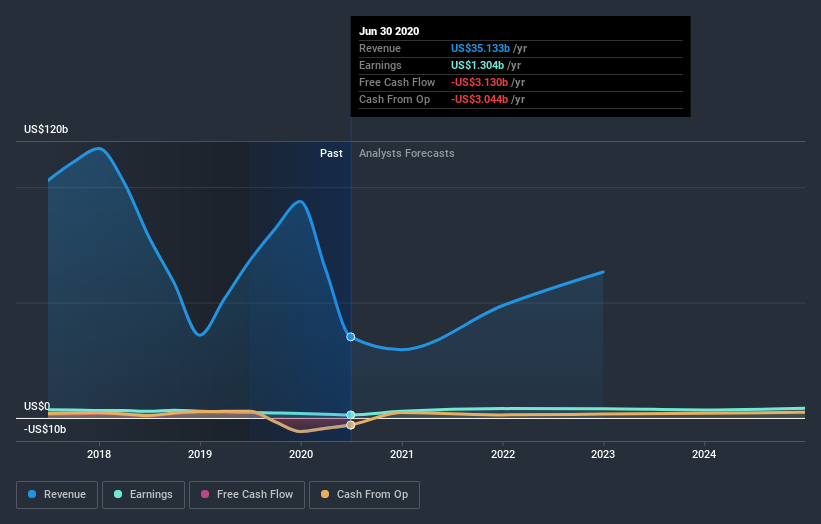
Prudential already has institutions on the share registry. Indeed, they own a respectable stake in the company. This suggests some credibility amongst professional investors. But we can't rely on that fact alone since institutions make bad investments sometimes, just like everyone does. If multiple institutions change their view on a stock at the same time, you could see the share price drop fast. It's therefore worth looking at Prudential's earnings history below. Of course, the future is what really matters.
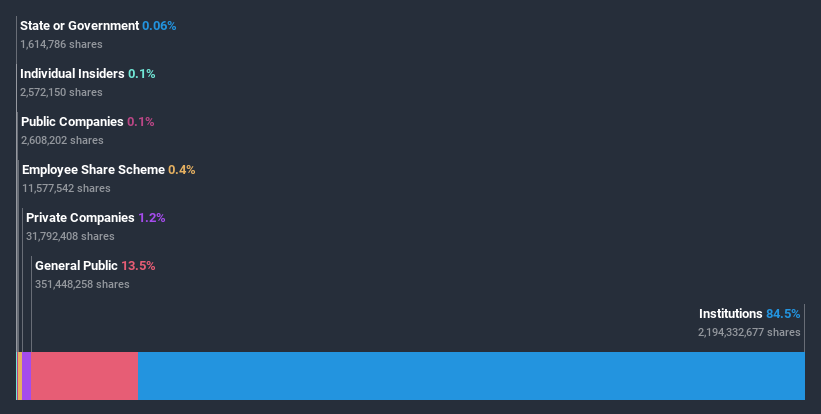
Institutional investors own over 50% of the company, so together than can probably strongly influence board decisions. Hedge funds don't have many shares in Prudential. Looking at our data, we can see that the largest shareholder is BlackRock, Inc. with 7.3% of shares outstanding. In comparison, the second and third largest shareholders hold about 3.8% and 3.5% of the stock.
Our studies suggest that the top 25 shareholders collectively control less than half of the company's shares, meaning that the company's shares are widely disseminated and there is no dominant shareholder.
While studying institutional ownership for a company can add value to your research, it is also a good practice to research analyst recommendations to get a deeper understand of a stock's expected performance. Quite a few analysts cover the stock, so you could look into forecast growth quite easily.
Insider Ownership Of Prudential
The definition of an insider can differ slightly between different countries, but members of the board of directors always count. Company management run the business, but the CEO will answer to the board, even if he or she is a member of it.
Most consider insider ownership a positive because it can indicate the board is well aligned with other shareholders. However, on some occasions too much power is concentrated within this group.
Our data suggests that insiders own under 1% of Prudential plc in their own names. We do note, however, it is possible insiders have an indirect interest through a private company or other corporate structure. Being so large, we would not expect insiders to own a large proportion of the stock. Collectively, they own UK£34m of stock. It is good to see board members owning shares, but it might be worth checking if those insiders have been buying.
General Public Ownership
The general public, with a 14% stake in the company, will not easily be ignored. While this size of ownership may not be enough to sway a policy decision in their favour, they can still make a collective impact on company policies.
Next Steps:
While it is well worth considering the different groups that own a company, there are other factors that are even more important. For instance, we've identified 2 warning signs for Prudential (1 is a bit concerning) that you should be aware of.
If you are like me, you may want to think about whether this company will grow or shrink. Luckily, you can check this free report showing analyst forecasts for its future.
NB: Figures in this article are calculated using data from the last twelve months, which refer to the 12-month period ending on the last date of the month the financial statement is dated. This may not be consistent with full year annual report figures.
This article by Simply Wall St is general in nature. It does not constitute a recommendation to buy or sell any stock, and does not take account of your objectives, or your financial situation. We aim to bring you long-term focused analysis driven by fundamental data. Note that our analysis may not factor in the latest price-sensitive company announcements or qualitative material. Simply Wall St has no position in any stocks mentioned.
Have feedback on this article? Concerned about the content? Get in touch with us directly. Alternatively, email editorial-team (at) simplywallst.com.
