Owning 39% in PaySign, Inc. (NASDAQ:PAYS) means that insiders are heavily invested in the company's future
Key Insights
PaySign's significant insider ownership suggests inherent interests in company's expansion
The top 6 shareholders own 51% of the company
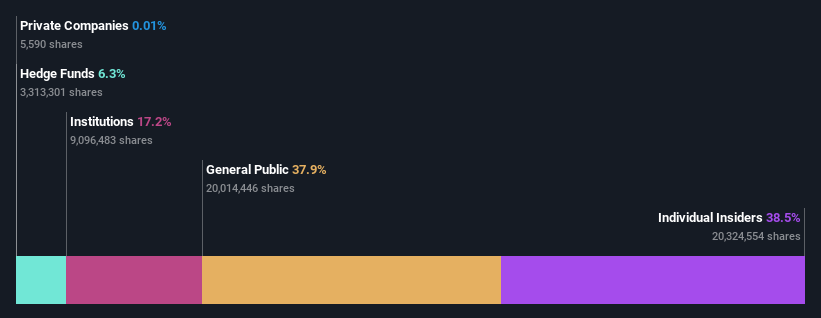
To get a sense of who is truly in control of PaySign, Inc. (NASDAQ:PAYS), it is important to understand the ownership structure of the business. We can see that individual insiders own the lion's share in the company with 39% ownership. In other words, the group stands to gain the most (or lose the most) from their investment into the company.
With such a notable stake in the company, insiders would be highly incentivised to make value accretive decisions.
In the chart below, we zoom in on the different ownership groups of PaySign.
Check out our latest analysis for PaySign
What Does The Institutional Ownership Tell Us About PaySign?
Institutions typically measure themselves against a benchmark when reporting to their own investors, so they often become more enthusiastic about a stock once it's included in a major index. We would expect most companies to have some institutions on the register, especially if they are growing.
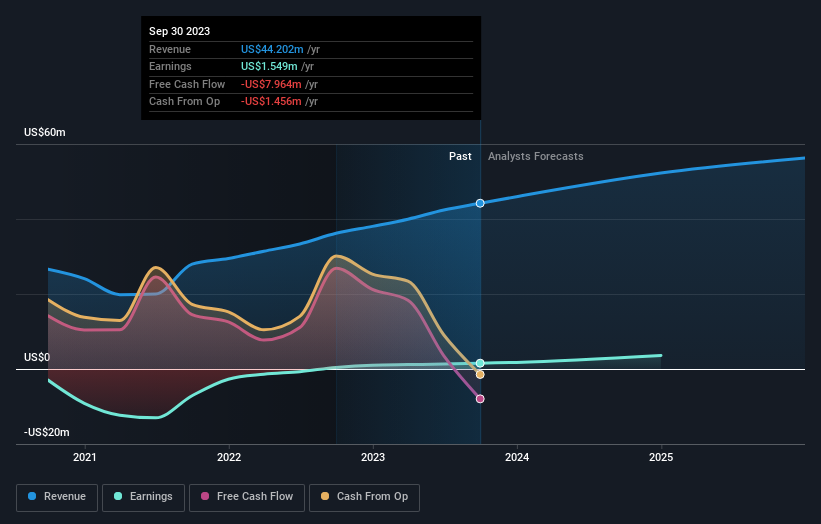
PaySign already has institutions on the share registry. Indeed, they own a respectable stake in the company. This implies the analysts working for those institutions have looked at the stock and they like it. But just like anyone else, they could be wrong. If multiple institutions change their view on a stock at the same time, you could see the share price drop fast. It's therefore worth looking at PaySign's earnings history below. Of course, the future is what really matters.
It would appear that 6.3% of PaySign shares are controlled by hedge funds. That catches my attention because hedge funds sometimes try to influence management, or bring about changes that will create near term value for shareholders. With a 18% stake, CEO Mark Newcomer is the largest shareholder. In comparison, the second and third largest shareholders hold about 17% and 6.3% of the stock.
We also observed that the top 6 shareholders account for more than half of the share register, with a few smaller shareholders to balance the interests of the larger ones to a certain extent.
Researching institutional ownership is a good way to gauge and filter a stock's expected performance. The same can be achieved by studying analyst sentiments. There are plenty of analysts covering the stock, so it might be worth seeing what they are forecasting, too.
Insider Ownership Of PaySign
The definition of an insider can differ slightly between different countries, but members of the board of directors always count. The company management answer to the board and the latter should represent the interests of shareholders. Notably, sometimes top-level managers are on the board themselves.
Most consider insider ownership a positive because it can indicate the board is well aligned with other shareholders. However, on some occasions too much power is concentrated within this group.
It seems insiders own a significant proportion of PaySign, Inc.. It has a market capitalization of just US$139m, and insiders have US$54m worth of shares in their own names. We would say this shows alignment with shareholders, but it is worth noting that the company is still quite small; some insiders may have founded the business. You can click here to see if those insiders have been buying or selling.
General Public Ownership
The general public, who are usually individual investors, hold a 38% stake in PaySign. While this size of ownership may not be enough to sway a policy decision in their favour, they can still make a collective impact on company policies.
Next Steps:
I find it very interesting to look at who exactly owns a company. But to truly gain insight, we need to consider other information, too. Take risks for example - PaySign has 1 warning sign we think you should be aware of.
If you would prefer discover what analysts are predicting in terms of future growth, do not miss this free report on analyst forecasts.
NB: Figures in this article are calculated using data from the last twelve months, which refer to the 12-month period ending on the last date of the month the financial statement is dated. This may not be consistent with full year annual report figures.
Have feedback on this article? Concerned about the content? Get in touch with us directly. Alternatively, email editorial-team (at) simplywallst.com.
This article by Simply Wall St is general in nature. We provide commentary based on historical data and analyst forecasts only using an unbiased methodology and our articles are not intended to be financial advice. It does not constitute a recommendation to buy or sell any stock, and does not take account of your objectives, or your financial situation. We aim to bring you long-term focused analysis driven by fundamental data. Note that our analysis may not factor in the latest price-sensitive company announcements or qualitative material. Simply Wall St has no position in any stocks mentioned.
