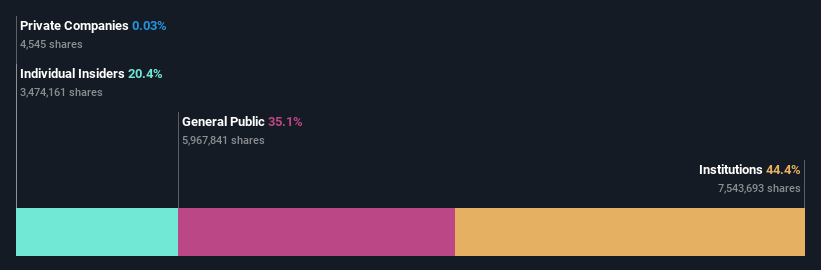
Owning 44% shares,institutional owners seem interested in Capital City Bank Group, Inc. (NASDAQ:CCBG),
Key Insights
Given the large stake in the stock by institutions, Capital City Bank Group's stock price might be vulnerable to their trading decisions
The top 12 shareholders own 50% of the company
If you want to know who really controls Capital City Bank Group, Inc. (NASDAQ:CCBG), then you'll have to look at the makeup of its share registry. With 44% stake, institutions possess the maximum shares in the company. In other words, the group stands to gain the most (or lose the most) from their investment into the company.
Given the vast amount of money and research capacities at their disposal, institutional ownership tends to carry a lot of weight, especially with individual investors. Hence, having a considerable amount of institutional money invested in a company is often regarded as a desirable trait.
Let's take a closer look to see what the different types of shareholders can tell us about Capital City Bank Group.
See our latest analysis for Capital City Bank Group
What Does The Institutional Ownership Tell Us About Capital City Bank Group?
Institutional investors commonly compare their own returns to the returns of a commonly followed index. So they generally do consider buying larger companies that are included in the relevant benchmark index.
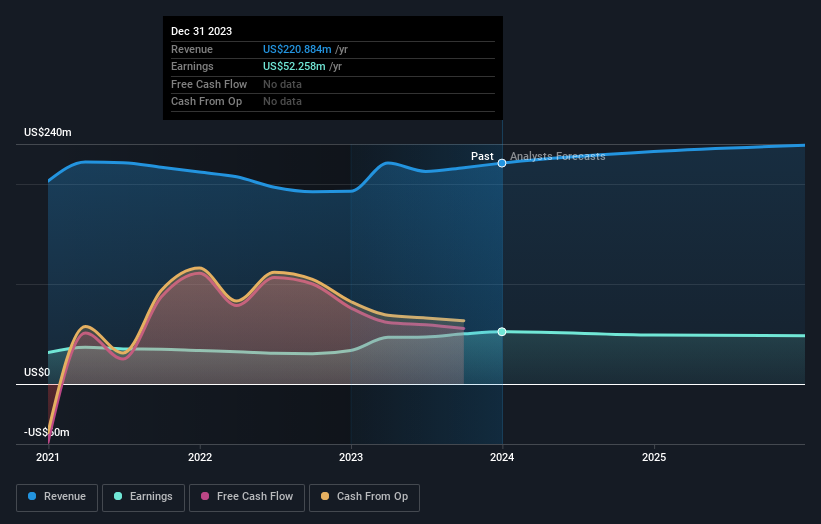
As you can see, institutional investors have a fair amount of stake in Capital City Bank Group. This suggests some credibility amongst professional investors. But we can't rely on that fact alone since institutions make bad investments sometimes, just like everyone does. If multiple institutions change their view on a stock at the same time, you could see the share price drop fast. It's therefore worth looking at Capital City Bank Group's earnings history below. Of course, the future is what really matters.
Hedge funds don't have many shares in Capital City Bank Group. Looking at our data, we can see that the largest shareholder is the CEO William Smith with 17% of shares outstanding. For context, the second largest shareholder holds about 11% of the shares outstanding, followed by an ownership of 5.0% by the third-largest shareholder.
Looking at the shareholder registry, we can see that 50% of the ownership is controlled by the top 12 shareholders, meaning that no single shareholder has a majority interest in the ownership.
While it makes sense to study institutional ownership data for a company, it also makes sense to study analyst sentiments to know which way the wind is blowing. There are plenty of analysts covering the stock, so it might be worth seeing what they are forecasting, too.
Insider Ownership Of Capital City Bank Group
The definition of an insider can differ slightly between different countries, but members of the board of directors always count. Company management run the business, but the CEO will answer to the board, even if he or she is a member of it.
Insider ownership is positive when it signals leadership are thinking like the true owners of the company. However, high insider ownership can also give immense power to a small group within the company. This can be negative in some circumstances.
It seems insiders own a significant proportion of Capital City Bank Group, Inc.. Insiders own US$102m worth of shares in the US$497m company. This may suggest that the founders still own a lot of shares. You can click here to see if they have been buying or selling.
General Public Ownership
The general public, who are usually individual investors, hold a 35% stake in Capital City Bank Group. While this group can't necessarily call the shots, it can certainly have a real influence on how the company is run.
Next Steps:
It's always worth thinking about the different groups who own shares in a company. But to understand Capital City Bank Group better, we need to consider many other factors. Consider risks, for instance. Every company has them, and we've spotted 1 warning sign for Capital City Bank Group you should know about.
Ultimately the future is most important. You can access this free report on analyst forecasts for the company.
NB: Figures in this article are calculated using data from the last twelve months, which refer to the 12-month period ending on the last date of the month the financial statement is dated. This may not be consistent with full year annual report figures.
Have feedback on this article? Concerned about the content? Get in touch with us directly. Alternatively, email editorial-team (at) simplywallst.com.
This article by Simply Wall St is general in nature. We provide commentary based on historical data and analyst forecasts only using an unbiased methodology and our articles are not intended to be financial advice. It does not constitute a recommendation to buy or sell any stock, and does not take account of your objectives, or your financial situation. We aim to bring you long-term focused analysis driven by fundamental data. Note that our analysis may not factor in the latest price-sensitive company announcements or qualitative material. Simply Wall St has no position in any stocks mentioned.
